. 2025 Aug;41(8):1390-1402.
doi: 10.1007/s12264-025-01387-3. Epub 2025 Apr 11.

Transcranial temporal interference stimulation precisely targets deep brain regions to regulate eye movements

Affiliations

Transcranial temporal interference stimulation precisely targets deep brain regions to regulate eye movements

Mo Wang et al. Neurosci Bull. 2025 Aug.

Abstract

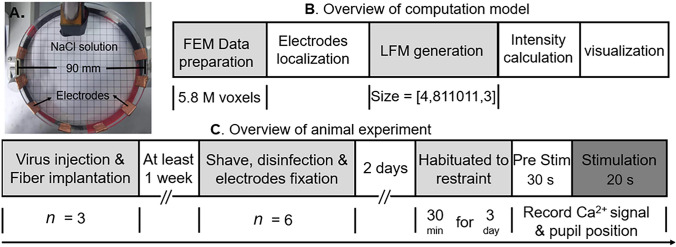
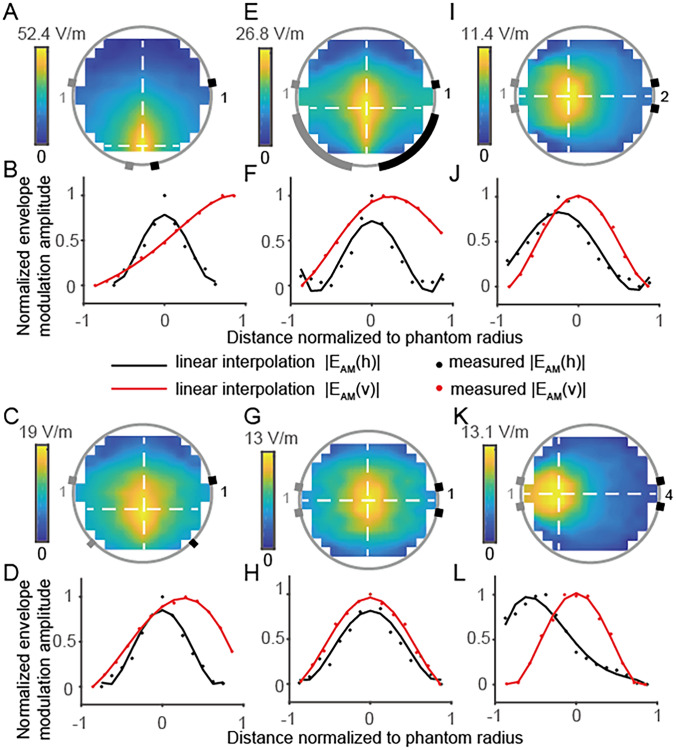
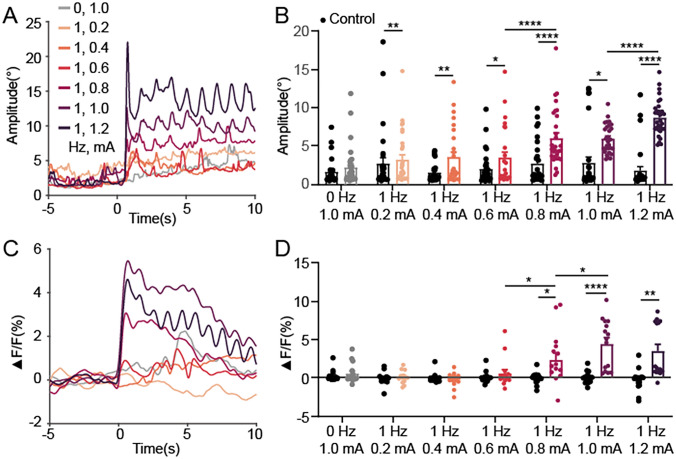
Transcranial temporal interference stimulation (tTIS) is a novel non-invasive neuromodulation technique with the potential to precisely target deep brain structures. This study explores the neural and behavioral effects of tTIS on the superior colliculus (SC), a region involved in eye movement control, in mice. Computational modeling revealed that tTIS delivers more focused stimulation to the SC than traditional transcranial alternating current stimulation. In vivo experiments, including Ca2+ signal recordings and eye movement tracking, showed that tTIS effectively modulates SC neural activity and induces eye movements. A significant correlation was found between stimulation frequency and saccade frequency, suggesting direct tTIS-induced modulation of SC activity. These results demonstrate the precision of tTIS in targeting deep brain regions and regulating eye movements, highlighting its potential for neuroscientific research and therapeutic applications.

Keywords: Eye movement; Finite element method; Superior colliculus; Temporal interference stimulation; Tissue phantom; Transcranial electrical stimulation.


Conflict of interest statement

Conflict of interest: The authors declare that they have no known competing financial interests or personal relationships that could have appeared to influence the work reported in this paper.

Figures

Fig. 1
Fig. 1
Overview. A Design of the tTIS stimulator. B Schematic of phantom. C Visualization of a finite element model of a mouse brain. D Schematic of the experimental setup. tTIS is applied to head-fixed mice. Meanwhile, the value of Ca2+ signals in the SC is recorded by fiber photometry, and pupil activity is recorded using a macro lens. E Two pairs of tTIS electrodes stimulate a conscious head-fixed mouse with currents I₁ and I2. F Representative image of GCaMP6s virus expression in the SC of a C57BL/6J mouse (green, GCaMP6s; scale bar, 200 μm). G Mean values of eye movement amplitudes (upper green curve) and Ca2+ signals in the SC (middle red curve) in three mice during tTIS (carrier frequency: 2000 Hz, difference frequency: 1 Hz, current: 1 mA; lower blue curve).
Fig. 2
Fig. 2
The Experimental Protocol. A Experimental Equipment of the Phantom: The tissue model is constructed using a petri dish with a diameter of 90 mm. The tissue model is filled with NaCl solution, and the concentration is adjusted so that the impedance between each pair of copper electrodes is 3 kΩ. B Flowchart of the Computational Model: Preparation: An FEM model with 5.8 million voxels is used. The electrode positions are located on the model according to the experimental design, and the Leadfield matrix (LFM) of the brain (811,011 voxels) is calculated. Stimulation: The electrical field strength at the corresponding ROI under different stimulation parameters is calculated. The results are linearly interpolated for better visualization. C Flowchart of Animal Experiments: Preparation: Virus injection and fiber optic implantation in half of the mice. One week later, electrode fixation surgery is performed on all mice. Acclimation: After two days, all mice are acclimated for three days (~30 min/day) to get used to the head immobilization system. Data Collection: Ca2+ signals and eye movements are recorded 5 s before and 10 s during stimulation.
Fig. 3
Fig. 3
The envelope of the interferential electrical field by tTIS on a cylindrical tissue phantom. A Envelope modulation amplitude maps when electrodes are placed in a trapezoidal geometry with a narrow base and the amplitudes of currents I₁ and I2 are set to 1 mA. B Red and blue lines are horizontal and vertical envelope modulation amplitude along white dotted lines separately, and currents and electrodes are shown in A. C Envelope modulation amplitude maps when electrodes are placed in a trapezoidal geometry with a wider base and the amplitudes of currents I₁ and I2 are set to 1 mA. D Envelope modulation amplitude along line cuts. Currents and electrodes are shown in C. E Envelope modulation amplitude maps with two larger electrodes (10 mm × 50 mm and 10 mm × 50 mm). The amplitudes of currents I₁ and I2 are set to 1 mA. F Envelope modulation amplitude along line cuts. Currents and electrodes are shown in E. G Envelope modulation amplitude maps when electrodes are placed in a rectangle with currents I₁ and I2 set to 1 mA. H Envelope modulation amplitude along line cuts. Currents and electrodes are shown in G. I Envelope modulation amplitude maps when electrodes are placed in a rectangle with currents in the ratio I₁: I2 = 1:2. J Envelope modulation amplitude along line cuts. Currents and electrodes are shown in I. K Envelope modulation amplitude maps when electrodes are placed in a rectangle with currents in the ratio I₁: I2 = 1:4. L Envelope modulation amplitude along line cuts. Currents and electrodes are shown in K.
Fig. 4
Fig. 4
Simulation results. A Schematic of Digimouse FEM model. The skull needle electrodes are securely attached to the skull without penetrating it, while patch electrodes are positioned on the skin of the cheeks. B An axial view of the electrical field under tTIS. This electrical field is generated by applying high-frequency current (2 mA) through two pairs of electrodes (red and green). C The electrical field generated by low-frequency current (2 mA) applied through a single pair of skull electrodes (shaped like needles). D The difference in the electrical field between tTIS and one-pair tACS. E The electrical field generated by low-frequency current (2 mA) applied through two pairs of electrodes (red and green). F The difference in the electrical field between tTIS and two-pair tACS. In all cases, the current across each pair of electrodes is controlled at 1 mA. The red circle indicates the SC region.
Fig. 5
Fig. 5
Eye movements and neural activity in the SC respond to tTIS with varying intensities. A Eye movement amplitudes respond to tTIS (beat frequency: 1 Hz, carrier frequency: 2000 Hz) with varying intensities (0.2–1.2 mA). Gray line, the control group (beat frequency: 0 Hz, carrier frequency: 2000 Hz, intensity: 1 mA). Sample size: n = 6 mice across 30 trials. B Comparison of eye movement amplitudes before and during tTIS (control group: average values of eye movement amplitudes within a 3-s window before stimulation; tTIS group: average values of eye movement amplitudes within a 3-s window at the onset of stimulation). Each data point is from an individual trial. n = 6 mice across 30 trials. C Ca2+ signals of neuronal populations in the SC respond to tTIS (beat frequency: 1 Hz, carrier frequency: 2000 Hz) with varying intensities (0.2–1.2 mA). Gray line, the control group (beat frequency: 0 Hz, carrier frequency: 2000 Hz, intensity: 1 mA). n = 3 mice across 15 trials. D Comparison of Ca2⁺ signals in the SC before and during tTIS (control group: average values of Ca2+ signal amplitudes in 3-s window before stimulation; tTIS group: average values of Ca2+ signal amplitudes in 3-s window at the beginning of stimulation). Each data point is from an individual trial. n = 3 mice, 15 trials.
Fig. 6
Fig. 6
The relationship between stimulation, eye movements, and Ca2+ signals. A–C Example showing individual trials of eye movements and Ca2+ signals in the SC from one mouse. D Power spectrum of eye movement amplitudes in the 1-Hz band during stimulations. n = 6 mice, 30 trials per frequency difference. E Power spectrum of Ca2+ signals in the SC in the 1-Hz band during stimulations. n = 3 mice, 15 trials per frequency difference. F Normalized power spectrum of eye movement amplitudes during tTIS. n = 6 mice, 30 trials. G Normalized power spectrum of Ca2+ signals in the SC during tTIS. n = 3 mice, 15 trials.

Similar articles

References

    1. Yu WS, Aquili L, Wong KH, Lo ACY, Chan LLH, Chan YS. Transcorneal electrical stimulation enhances cognitive functions in aged and 5XFAD mouse models. Ann N Y Acad Sci 2022, 1515: 249–265. - PubMed
    1. Zarifkar AH, Zarifkar A, Nami M, Rafati A, Aligholi H, Vafaee F. Ameliorative effects of different transcranial electrical stimulation paradigms on the novel object recognition task in a rat model of Alzheimer disease. Galen Med J 2019, 8: e1440. - PMC - PubMed
    1. Van Schuerbeek A, Vanderhasselt MA, Baeken C, Pierre A, Smolders I, Van Waes V, et al. Effects of repeated anodal transcranial direct current stimulation on auditory fear extinction in C57BL/6J mice. Brain Stimul 2021, 14: 250–260. - PubMed
    1. Vanderhasselt MA, De Raedt R, Namur V, Lotufo PA, Bensenor IM, Boggio PS, et al. Transcranial electric stimulation and neurocognitive training in clinically depressed patients: A pilot study of the effects on rumination. Prog Neuropsychopharmacol Biol Psychiatry 2015, 57: 93–99. - PubMed
    1. Benninger DH, Lomarev M, Lopez G, Wassermann EM, Li X, Considine E, et al. Transcranial direct current stimulation for the treatment of Parkinson’s disease. J Neurol Neurosurg Psychiatry 2010, 81: 1105–1111. - PMC - PubMed

LinkOut - more resources