. 2025 Apr 15;122(15):e2410748122.
doi: 10.1073/pnas.2410748122. Epub 2025 Apr 11.

Interactions among nutrients govern the global grassland biomass-precipitation relationship

Affiliations

Interactions among nutrients govern the global grassland biomass-precipitation relationship

Philip A Fay et al. Proc Natl Acad Sci U S A. .

Abstract

Ecosystems are experiencing changing global patterns of mean annual precipitation (MAP) and enrichment with multiple nutrients that potentially colimit plant biomass production. In grasslands, mean aboveground plant biomass is closely related to MAP, but how this relationship changes after enrichment with multiple nutrients remains unclear. We hypothesized the global biomass-MAP relationship becomes steeper with an increasing number of added nutrients, with increases in steepness corresponding to the form of interaction among added nutrients and with increased mediation by changes in plant community diversity. We measured aboveground plant biomass production and species diversity in 71 grasslands on six continents representing the global span of grassland MAP, diversity, management, and soils. We fertilized all sites with nitrogen, phosphorus, and potassium with micronutrients in all combinations to identify which nutrients limited biomass at each site. As hypothesized, fertilizing with one, two, or three nutrients progressively steepened the global biomass-MAP relationship. The magnitude of the increase in steepness corresponded to whether sites were not limited by nitrogen or phosphorus, were limited by either one, or were colimited by both in additive, or synergistic forms. Unexpectedly, we found only weak evidence for mediation of biomass-MAP relationships by plant community diversity because relationships of species richness, evenness, and beta diversity to MAP and to biomass were weak or opposing. Site-level properties including baseline biomass production, soils, and management explained little variation in biomass-MAP relationships. These findings reveal multiple nutrient colimitation as a defining feature of the global grassland biomass-MAP relationship.

Keywords: diversity; grasslands; precipitation; primary productivity.


Conflict of interest statement

Competing interests statement:The authors declare no competing interest.

Figures
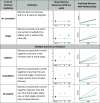
Fig. 1.
Fig. 1.
Conceptual framework for predicting changes in the steepness of the global mean aboveground biomass–MAP relationship in response to fertilization with hypothetically limiting nutrients A, B, and A together with B (AB). A and B represent any two nutrients that potentially limit biomass production. The mean response of biomass across sites to fertilization defines the number of nutrients limiting aboveground biomass and the form of interactions among colimiting nutrients—additive, subadditive, or synergistic. The increase in slope of the grassland biomass–MAP relationship is predicted from the mean biomass response. Limitation forms are generalized from ref. . Application of the rubric is detailed in SI Appendix, Extended Methods.
Fig. 2.
Fig. 2.
Responses of the global mean biomass—MAP relationship to fertilization with single N, P, and potassium with micronutrients (Kµ). (A) The biomass–MAP relationships for treatments fertilizing with 0, 1, 2, or 3 nutrients. Inset: the percent increase in linear regression slope relative to unfertilized controls. (B) the biomass–MAP relationships for treatments fertilizing with N, P, and Kµ in factorial combinations. Nutrient treatments are color-coded as in Panel C. (Inset) The percent increase in linear regression slopes relative to unfertilized controls for N, P, and NP treatments averaged across levels of Kµ. (C) Mean ± SE of aboveground biomass across all 71 sites for the factorial N, P, and Kµ fertilization treatments. See Table 1 for linear mixed model analyses and SI Appendix, Table S2 for linear regression equations.
Fig. 3.
Fig. 3.
Aboveground biomass in relation to MAP for sites classified by form of response to N and P fertilization. (A) No Limitation, (B) Limited by Single N or P, (C) Additive limitation by N and P, (D) Synergistic limitation by N and P). Response forms are defined in Fig. 1. N and P treatments are averaged across levels of Kµ fertilization. Insets depict the slopes for unfertilized control (C), N, P, and N together with P. Upper panels are kernel-smoothed MAP distributions for the sites each form of limitation. See Table 2 for linear mixed model analyses and SI Appendix, Table S2 for linear regression equations.
Fig. 4.
Fig. 4.
Baseline global biomass–MAP relationships defined by unfertilized controls across sites classified by form of response to N and P fertilization (Fig. 3). (A) Biomass–MAP relationships across the MAP range spanned by all 71 sites. (B) Biomass–MAP relationships for sites with MAP up to 1,013 mm. See Table 3 for linear mixed models analyses and SI Appendix, Table S2 for linear regression equations.
Fig. 5.
Fig. 5.
Summary of the standardized effects of nutrient addition and MAP on aboveground biomass production from structural equation models fit (Table 4) across grassland sites in each of four forms of nutrient limitation. (A) Sankey plot depicting Total effects (direct + indirect) of number of nutrients and MAP (Left side) mapped onto each form of nutrient limitation (Right side). The widths of the links depict the magnitude of each total effect for each limitation form. (B) Direct and (C) indirect effects (±SE) of MAP and nutrient addition for each limitation form. Indirect effects represent community mediation of MAP and nutrient effects on biomass, and combine paths through effective species richness, species evenness, and beta diversity (SI Appendix, Fig. S3).

References

    1. Douville H., et al. , “Water cycle changes” in Climate Change 2021: The Physical Science Basis. Contribution of Working Group I to the Sixth Assessment Report of the Intergovernmental Panel on Climate Change, Masson-Delmotte V., et al., Eds. (Cambridge University Press, Cambridge, United Kingdom and New York, NY, 2021), pp. 1055–1210, 10.1017/9781009157896.010. - DOI
    1. Rockström J., et al. , A safe operating space for humanity. Nature 461, 472–475 (2009). - PubMed
    1. Bloom A. J., Chapin F. S. III, Mooney H. A., Resource limitation in plants-an economic analogy. Ann. Rev. Ecol. Sys. 16, 363–392 (1985).
    1. Chapin F. S., Bloom A. J., Field C. B., Waring R. H., Plant-responses to multiple environmental-factors. Bioscience 37, 49–57 (1987).
    1. Gleeson S. K., Tilman D., Plant allocation and the multiple limitation hypothesis. Am. Nat. 139, 1322–1343 (1992).

LinkOut - more resources