. 2025 Apr 11;11(15):eadr5011.
doi: 10.1126/sciadv.adr5011. Epub 2025 Apr 11.

Control of morphogenesis during the Staphylococcus aureus cell cycle

Affiliations

Control of morphogenesis during the Staphylococcus aureus cell cycle

Mariana Tinajero-Trejo et al. Sci Adv. .

Abstract

Bacterial cell division is a complex, multistage process requiring septum development while maintaining cell wall integrity. A dynamic, macromolecular protein complex, the divisome, tightly controls morphogenesis both spatially and temporally, but the mechanisms that tune septal progression are largely unknown. By studying conditional mutants of genes encoding DivIB, DivIC, and FtsL, an essential trimeric complex central to cell division in bacteria, we demonstrate that FtsL and DivIB play independent, hierarchical roles coordinating peptidoglycan synthesis across specific septal developmental checkpoints. They are required for the localization of downstream divisome components and the redistribution of peptidoglycan synthesis from the cell periphery to the septum. This is achieved by positive regulation of septum production and negative regulation of peripheral cell wall synthesis. Our analysis has led to a model for the coordination of cell division in Staphylococcus aureus, forming a framework for understanding how protein localization and function are integrated with cell wall structural dynamics across the bacteria.


Figures
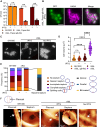
Fig. 1.
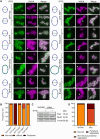
Fig. 1.. FtsL is required for cell survival, size regulation, and septum development.
(A) Plating efficiency of SH1000 and ΔftsL, Pspac-ftsL (SJF5665) and ΔftsL, Pspac-gfp-ftsL (SJF5666) grown for 2 hours with IPTG followed by overnight growth in solid medium with and without the inducer. Data are the mean and SD of three independent experiments. P values were determined by two-tailed unpaired t test (from left to right, **P = 0.0027 and 0.0012). n.s., not significant. (B) Fluorescence microscopy images of ΔftsL, Pspac-gfp-ftsL (SJF5666) grown for 1 hour with IPTG. Cells labeled with HADA for 30 min show cell morphology. (C) Fluorescence microscopy images of SH1000 and ΔftsL (SJF5665) cells grown for 1 h with or without IPTG. PG was labeled by 30-min incubation with HADA. Images are average z-stack intensity projections. Scale bars, 2 μm. Images are representative of two independent experiments. (D) Cell volumes of SH1000 and ΔftsL cells determined from images of cells stained with NHS-ester 555 (fig. S1E). Each circle indicates a single cell. n = 50 cells per sample. P values were determined by Mann-Whitney U tests (****P < 0.0001). (E) Classification of cell stages of division based on 30-min HADA labeling [as shown in (C)] (left) and septal defects classification (right). n = 300 cells per sample. (F) AFM descriptive comparison between images of SH1000 and ΔftsL (SJF5665) sacculi of cells grown for 1 hour with or without IPTG. Images show the structural features of piecrust in SH1000, cells expressing FtsL (dashed arrows), and in FtsL-depleted cells (solid arrow). Incomplete septa from the parental and ΔftsL (SJF5665) strains grown with IPTG are shown (cells with incomplete septum were absent in the absence of the inducer).
Fig. 2.
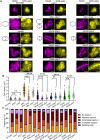
Fig. 2.. FtsL is essential for the localization of DivIC and PBP2 to mid-cell during cell division.
(A) Fluorescence microscopy images of ΔftsL cells expressing fluorescent fusions of ftsL (GFP-FtsL, SJF5936), ezrA (EzrA-GFP, SJF5696), divIC (DivIC-GFP, SJF5693), divIB (GFP-DivIB, SJF5694), pbp1 (GFP-PBP1, SJF5932), ftsW (FtsW-GFP, SJF5769), and pbp2 (GFP-PBP2, SJF5695) grown for 1 hour in the presence (+) or absence (−) of IPTG. PG was labeled by 30-min incubation with HADA. ΔftsL was labeled with Bocillin for 5 min with or without IPTG (right, bottom panel). Images are average z-stack intensity projections. Scale bars, 2 μm. Images are representative of two independent experiments. Diagrams depict the most frequent patterns of the fluorescent fusion localization and Bocillin (mid-cell or peripheral) (green), the overall cell morphology (blue), and the mid-cell position (red). White arrows show peripheral HADA labeling. (B) Frequency of fluorescent fusion localization in ΔftsL cells in the absence of IPTG [based on images in (A)]. Only cells showing incorporation of HADA at mid-cell were considered. n > 100 cells per sample. Mid-cell localization of the fluorescent fusions in the parental strain is shown in fig. S5 (A and B). (C) Western blot of whole-cell lysates of SH1000 and ΔftsL (SJF5665) grown for 1 hour in the presence or absence of IPTG. Anti-FtsL and anti-DivIC antibodies were used for detection. Detection of YmdA with anti-YmdA antibodies is shown as loading control. Results are representative of three biological repeats (fig. S2A shows signal quantification). (D) Frequency of localization of fluorescent Bocillin in ΔftsL cells (SJF5665) [based on images in (A), right-bottom panel]. Frequency of Bocillin localization in the parental strain is shown for comparison. Only cells showing incorporation of HADA at mid-cell were considered. n > 150 cells per sample.
Fig. 3.
Fig. 3.. The C-terminal domain of FtsL is essential for function.
(A) Topological model of FtsL. Amino acids marking the end of each deletion construct are shown for the exoplasmic (red) and the cytoplasmic (green) domains. (B) FtsL (SJF5781) or truncated versions of the protein from the C-terminal [ΔV122-N133 (SJF5782), ΔK111-N133 (SJF5783), or ΔA69-N133 (SJF5785)] or the N-terminal domain (ΔA2-T41, SJF5803) detected by Western blot. Whole-cell lysates of cultures grown for 1 hour without IPTG were detected using anti-FtsL antibodies. Anti–protein A antibodies were used as a control. (C) Viability test of ΔftsL cells expressing FtsL or the truncated versions of the protein. Cells were grown for 1 hour in the presence and absence of IPTG followed by growth in solid medium with IPTG. Data are the mean and SD of three independent experiments. P values were determined by two-tailed unpaired t test (from left to right, ***P = 0.0003 and 0.0001). (D) Survival of ΔftsL cells expressing FtsL or the truncated versions of the protein grown in the absence of IPTG followed by growth on solid medium with IPTG. Means and SDs of three independent experiments are shown. (E) Fluorescence microscopy images of ΔftsL cells expressing FtsL or truncated versions of the protein after growing for 1 hour in the absence of IPTG. Cells labeled with HADA for 30 min and stained with NHS-ester 555 show cell morphology. (F) Volume determined from cells stained with NHS-ester 555 [based on images in (E)]. Each circle indicates a single cell. n = 50 cells per sample. P values were determined by Mann-Whitney U tests (****P < 0.0001). (G) Classification of cell stages of division based on HADA labeling [based on images in (E)]. n > 200 cells per sample.
Fig. 4.
Fig. 4.. FtsL and DivIB control the activity of PBP3 and PBP4 during cell division.
(A) Fluorescence microscopy of SH1000, pbp3 (SJF5985), pbp4 (SJF5989), ΔftsL (SJF5665), ΔftsL pbp3 (SJF5984), ΔftsL pbp4 (SJF5988), ΔdivIB (SJF3883) ΔdivIB pbp3 (SJF5982), ΔdivIB pbp4 (SJF5986), ΔdivIC (SJF5450), ΔdivIC pbp3 (SJF6009), ΔdivIC pbp4 (SJF6010), ΔftsW (SJF5761), ΔftsW pbp3 (SJF5983), and ΔftsW pbp4 (SJF5987). Cells were grown for 1 hour in the absence of IPTG (ΔdivIB and its derivatives were grown for 2 hours). PG was labeled by 30-min incubation with HADA. Staining with NHS-ester 555 shows cell morphology. Images are average z-stack intensity projections. Scale bars, 2 μm. Images are representative of two independent experiments. Diagrams depict the most frequent phenotype; cell morphology (blue) and piecrust or incomplete septum (red) [based on data from (C)]. (B) Volume determined from cells stained with NHS-ester 555 [based on images in (A)]. Each circle indicates a single cell. n = 100 cells per sample. P values were determined by Mann-Whitney U tests (****P < 0.0001; **P < 0.0016). (C) Classification of cell stages of division based on HADA labeling [based on images in (A)]. n > 250 cells per sample.
Fig. 5.
Fig. 5.. Localization of MurJ to mid-cell is partially affected by FtsL but is independent of DivIC and DivIB.
(A) Fluorescence microscopy images of SH1000 ΔftsL (SJF5957), ΔdivIC (SJF5959), and ΔdivIB (SJF5960) expressing MurJ-GFP were grown in the presence and absence of IPTG for 1, 2, and 2 hours, respectively. Incorporation of PG was followed for 5 min with HADA. Staining with NHS-ester 555 shows cell morphology. Images are average z-stack intensity projections. Scale bars, 2 μm. Images are representative of two independent experiments. Diagrams depict the patterns of the fluorescent fusion localization. Diagrams depict the most frequent patterns of the fluorescent fusion localization (mid-cell, mid-cell plus peripheral aggregates, or peripheral aggregates only) (green), the overall cell morphology (blue), and the mid-cell position (red). (B) Quantification of MurJ-GFP localization at mid-cell [based on images in (A)] for ΔftsL, ΔdivIC, and ΔdivIB as above with localization defined as in Fig. 2D. Only cells showing incorporation of HADA at mid-cell were considered. n > 200 cells per sample.
Fig. 6.
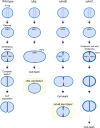
Fig. 6.. FtsL, DivIB, and DivIC have essential roles in septum development and cell morphology in S. aureus by controlling PBP localization and activity.
In wild-type cells, septal synthesis starts with a PG foundation structure, the piecrust (red), which supports septal plate formation by PBP1 and then PBP2. In FtsL-depleted cells (denoted ΔftsL), DivIC and PBP2 remain peripheral despite the presence of a piecrust. This causes a blockage on the formation of the septal plate. Also, the absence of FtsL results in deregulation of PBP3 and PBP4, causing elongation and volume increase (yellow square). These changes ultimately lead to cell death. In DivIB-depleted cells (ΔdivIB) (29), DivIC and PBP2 are localized to mid-cell, allowing the progression of PG synthesis inward; however, the septal plate cannot be completed. PBP1 does not localize to the division site in the absence of DivIB, suggesting the involvement of PBP1 in septum completion. In DivIB-depleted cells, PBP3 and PBP4 (yellow square) are deregulated, causing morphological defects and volume increase. These changes cause cell death and lysis. In DivIC-depleted cells, PBP2 mainly remains peripheral, causing abnormal thickening of the surrounding cell wall (30). DivIC-depleted cells increase in volume in a PBP3/PBP4-independent way. These changes eventually lead to cell death.

References

    1. Typas A., Banzhaf M., Gross C. A., Vollmer W., From the regulation of peptidoglycan synthesis to bacterial growth and morphology. Nat. Rev. Microbiol. 10, 123–136 (2011). - PMC - PubMed
    1. Pinho M. G., Kjos M., Veening J.-W., How to get (a)round: Mechanisms controlling growth and division of coccoid bacteria. Nat. Rev. Microbiol. 11, 601–614 (2013). - PubMed
    1. Mahone C. R., Goley E. D., Bacterial cell division at a glance. J. Cell Sci. 133, jcs237057 (2020). - PMC - PubMed
    1. Buddelmeijer N., Beckwith J., A complex of the Escherichia coli cell division proteins FtsL, FtsB and FtsQ forms independently of its localization to the septal region. Mol. Microbiol. 52, 1315–1327 (2004). - PubMed
    1. Noirclerc-Savoye M., Le Gouëllec A., Morlot C., Dideberg O., Vernet T., Zapun A., In vitro reconstitution of a trimeric complex of DivIB, DivIC and FtsL, and their transient co-localization at the division site in Streptococcus pneumoniae. Mol. Microbiol. 55, 413–424 (2005). - PubMed