. 2025 Apr 11;11(15):eadr5235.
doi: 10.1126/sciadv.adr5235. Epub 2025 Apr 11.

Discovery of synthetic small molecules targeting the central regulator of Salmonella pathogenicity

Affiliations

Discovery of synthetic small molecules targeting the central regulator of Salmonella pathogenicity

Abdelhakim Boudrioua et al. Sci Adv. .

Abstract

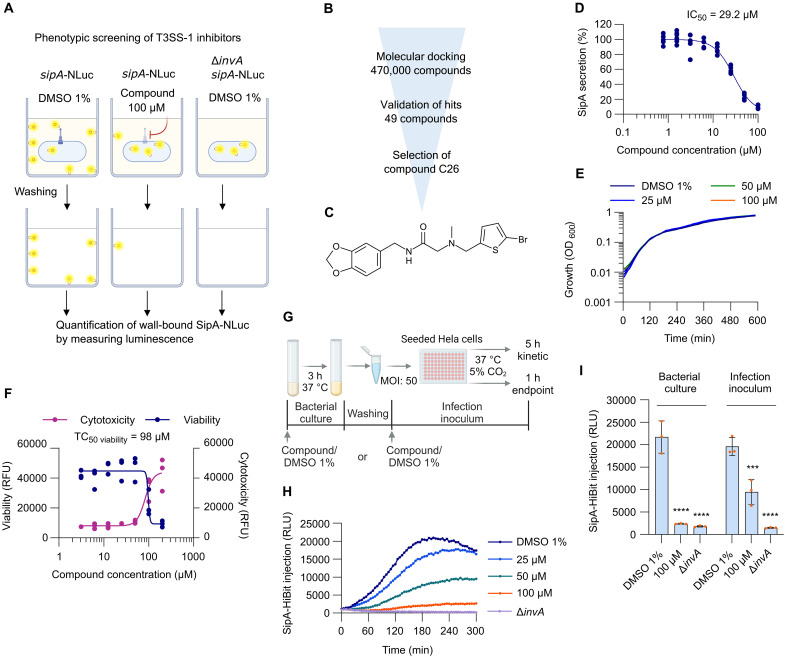
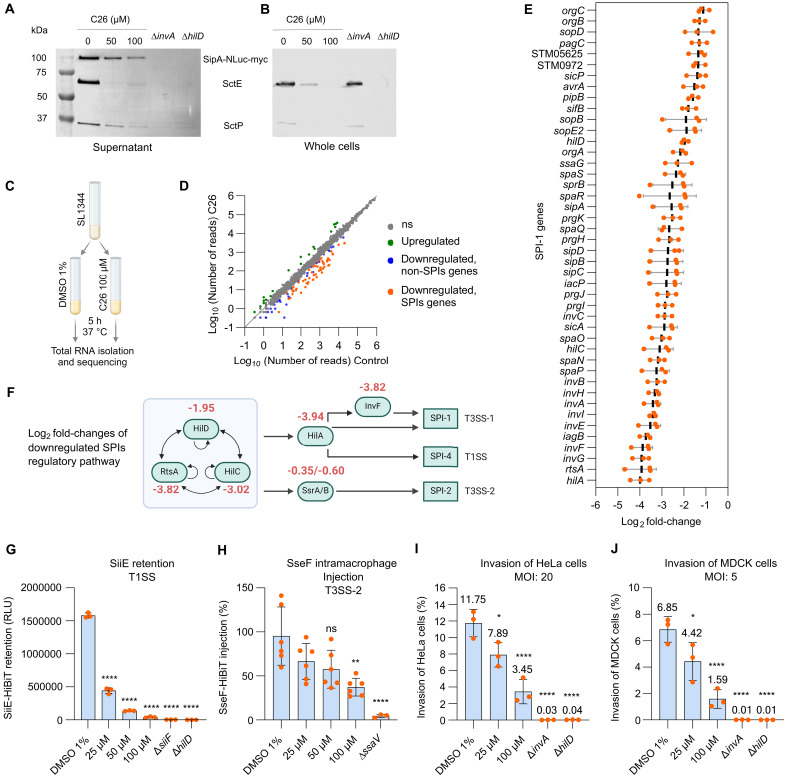
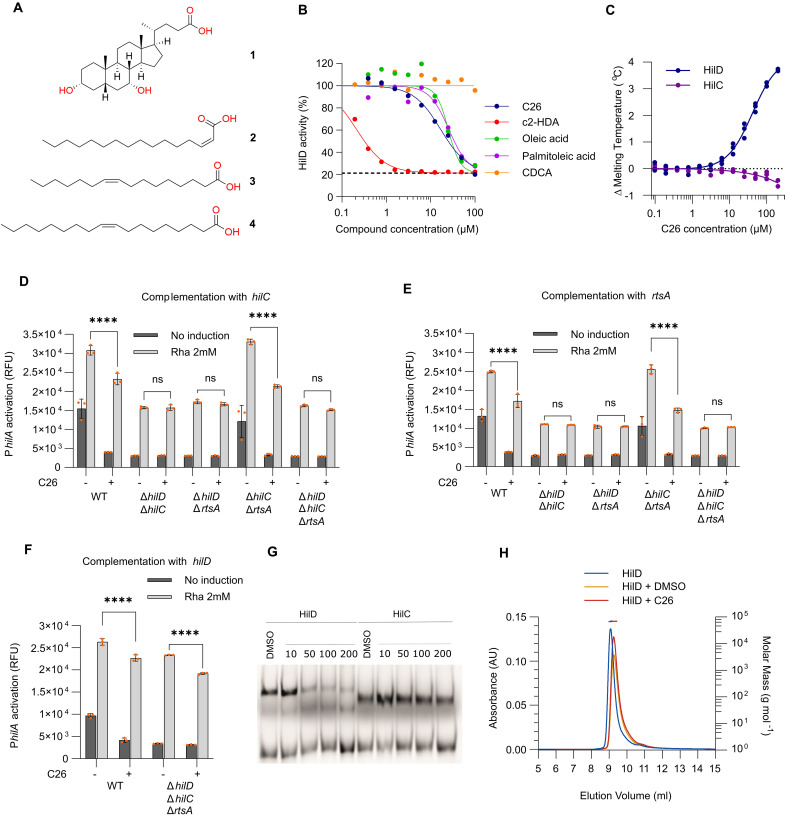
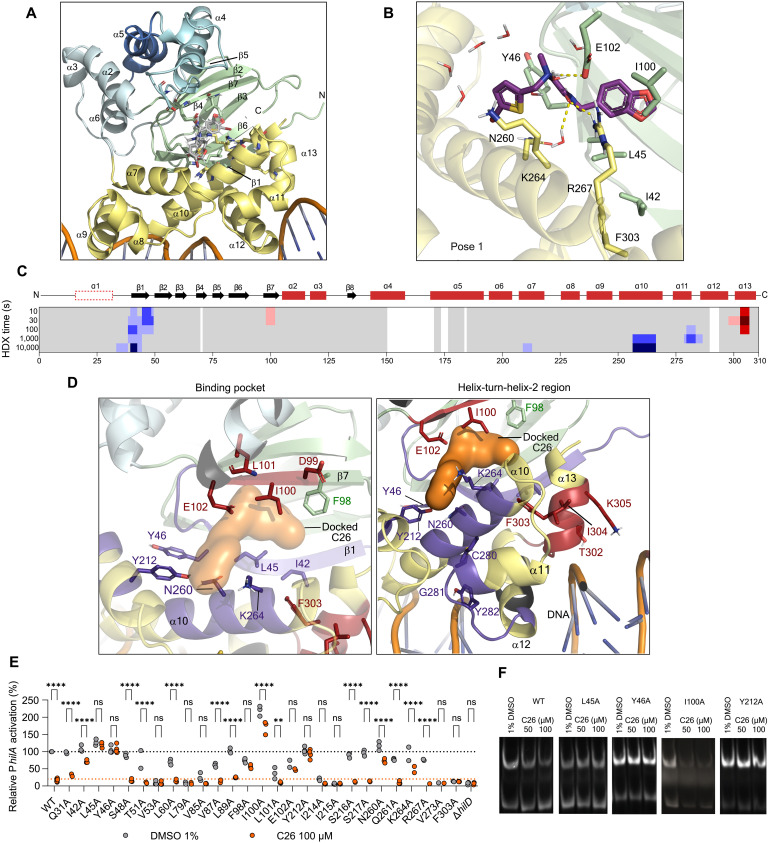
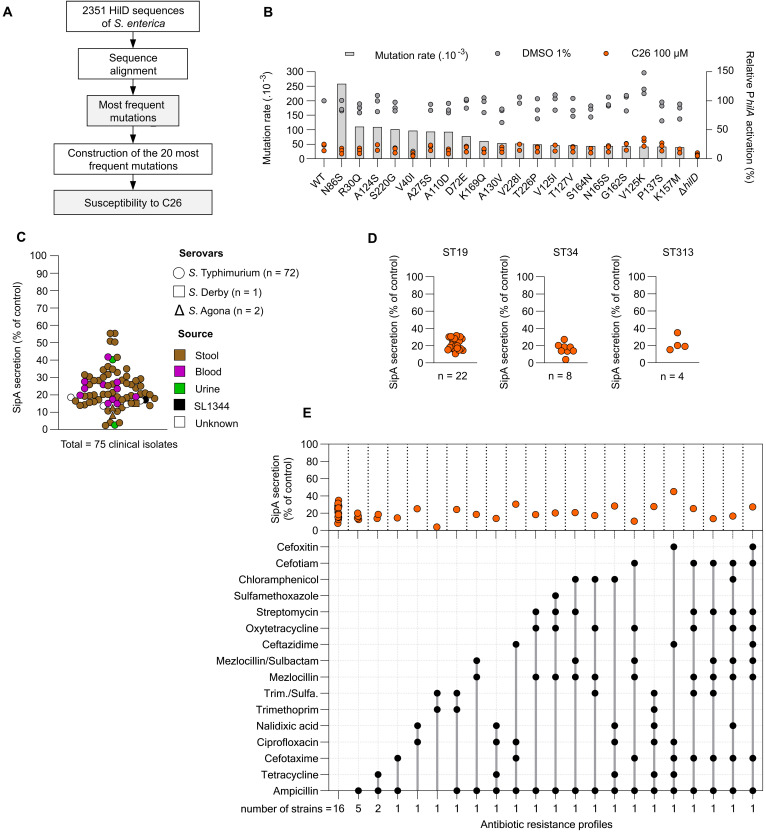
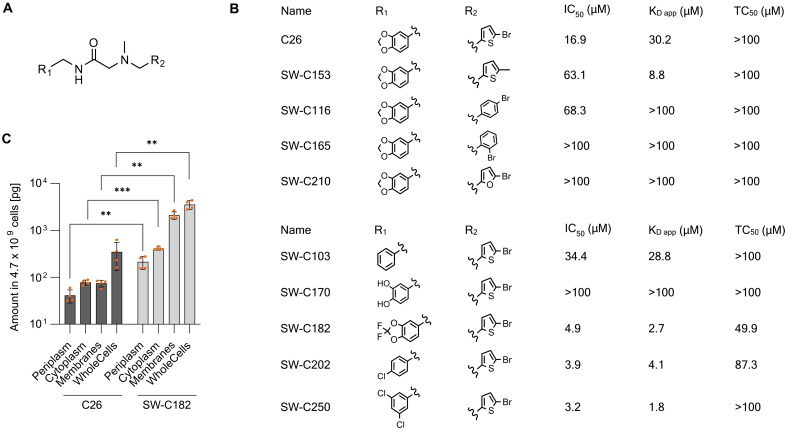
The enteric pathogen Salmonella enterica serovar Typhimurium relies on the activity of effector proteins to invade, replicate, and disseminate into host epithelial cells and other tissues, thereby causing disease. Secretion and injection of effector proteins into host cells is mediated by dedicated secretion systems, which hence represent major virulence determinants. Here, we report the identification of a synthetic small molecule with drug-like properties, C26, which suppresses the secretion of effector proteins and consequently hinders bacterial invasion of eukaryotic cells. C26 binds to and inhibits HilD, the transcriptional regulator of the major secretion systems. Although sharing the same binding pocket as the previously described long-chain fatty acid ligands, C26 inhibits HilD with a unique binding mode and a distinct mechanism. We provide evidence of intramacrophage activity and present analogs with improved potency and suitability as scaffolds to develop antivirulence agents against Salmonella infections in humans and animals.


Figures

Fig. 1.
Fig. 1.. Identification of T3SS-1 inhibitors.
(A) NanoLuc Luciferase assay to screen T3SS-1 inhibitors in 384-well plates. Compounds were screened at a final concentration of 100 μM (N = 3 replicates). Cultures with strains sipA-NLuc and ΔinvA, sipA-NLuc with 1% (v/v) DMSO were used as positive and negative controls, respectively. Figure created with BioRender. (B) Screening workflow applied to identify T3SS-1 inhibitors. (C) Chemical structure of compound C26. (D) Dose-response curve of SipA secretion with increasing concentrations of C26. 100% relative SipA secretion corresponds to the luminescence intensity of the WT strain grown in the presence of 1% (v/v) DMSO. The relative SipA secretion of the ∆invA mutant was considered as the bottom (N = 2 technical replicates within N = 3 biological replicates). (E) Growth of S. Typhimurium SL1344 in LB medium supplemented with C26 at different concentrations or 1% (v/v) DMSO. Experiment performed in a 96-well plate. Growth assessed by measuring the OD at 600 nm (N = 3 biological replicates). (F) In vitro toxicity in HeLa cells exposed to 100 μM C26 for 18 hours using the ApoTox-Glo assay. Fluorescence was measured as a readout for viability 400Ex/505Em and cytotoxicity 485Ex/520Em (N = 3 biological replicates). (G) Description of the experimental plan used to monitor SipA-HiBiT injection into HeLa cells. Figure created with BioRender. h, hours. (H) Kinetic of SipA-HiBiT injection intro HeLa cells when the compound or DMSO (1%) was added to the bacterial culture. MOI: 50. Representative replicate from three independent experiments. (I) Effect of C26 at 100 μM on the injection of SipA-HiBiT into HeLa cells when added to the bacterial culture or only to the infection inoculum. Endpoint measurement 1 hour postinfection. MOI: 50. ***P < 0.001; ****P < 0.0001 (Bonferroni’s multiple comparisons test). N = 3 biological replicates.
Fig. 2.
Fig. 2.. C26 targets the regulatory pathway of SPIs and reduces invasion into host cells.
(A and B) Abundance of T3SS-1 effector proteins in the supernatant (A) and in whole cells (B) monitored by Western blotting. Mouse anti-myc (1:1000), anti-SctE (1:1000), and anti-SctP (1:1000) antibodies were used to quantify SipA, SctE (SipB), and SctP (invJ), respectively. (C) Experimental plan of the transcriptome analysis by RNA-seq. (D) Scatterplot representing the level of gene expression when bacteria were grown in the presence of C26 (100 μM) or DMSO [1% (v/v)] as a control condition. n.s., not significant. Green: Up-regulated genes. Orange: Down-regulated genes encoded in SPIs. Blue: Down-regulated genes that are not encoded in SPIs. Gray: Below statistical cutoff. (E) Log2 FCs in the expression of SPI-1–encoded genes in the presence of C26 (100 μM) (N = 3 biological replicates). (F) Regulation of SPI-encoded genes. The log2 FCs in gene expression in the presence of C26 (100 μM) are indicated in red. (G) Activity of C26 on the cell surface retention of SiiE-HiBiT. ∆siiF and ∆hilD mutants were used as controls for lack of SiiE secretion and expression, respectively. N = 3 biological replicates. (H) Activity of C26 on T3SS-2 as quantified by measuring the injection of SseF-HiBiT inside macrophages RAW 264.7 expressing LgBiT. The ∆ssaV mutant was used as a control for the lack of T3SS-2 activity. MOI: 10. N = 6 biological replicates, except for ΔssaV mutant for which N = 3 biological replicates. (I and J) Invasion of HeLa cells, MOI: 20 (I) and MDCK cells, MOI: 5 (J) by S. Typhimurium in the presence of C26. ∆invA and ∆hilD mutants were used as negative controls. N = 3 biological replicates. *P < 0.05; **P < 0.01; ****P < 0.0001 (Bonferroni’s multiple comparisons test).
Fig. 3.
Fig. 3.. C26 targets the transcriptional regulator HilD.
(A) Structure of the HilD inhibitors CDCA (1), c2-HDA (2), palmitoleic acid (3), and oleic acid (4). (B) Whole-cell HilD activity assay. Dose-response curve of PhilA-sfGFP expression with increasing concentrations of C26 and other known HilD inhibitors. Fluorescence measured at 485Ex/510Em (N = 3 biological replicates). The dashed line corresponds to the baseline ∆hilD. (C) Changes in the calculated melting temperature of HilD and HilC upon incubation with increasing concentrations of C26, as determined from the fluorescence at 350 nm by NanoDSF, (N = 3 separate experiments). (D and E) Effect of C26 (100 μM) on PhilA activation in different background strains complemented with hilC (D) or rtsA (E). n.s., not significant; ****P < 0.0001 (Bonferroni’s multiple comparisons test). N = 3 biological replicates. (F) Effect of C26 (100 μM) on strains overexpressing hilD. ****P < 0.0001 (Bonferroni’s multiple comparisons test). N = 3 biological replicates. (G) EMSA showing the effect of C26 on the binding of purified HilD and HilC to the promoter of hilA. (H) SEC-MALS analysis of HilD in the presence of DMSO (1%) or C26 (100 μM). Left x axis shows UV absorbance measured at 280 nm. Right x axis shows the calculated molecular weight values from light scattering, highlighted by horizontal dashes. AU, arbitrary units.
Fig. 4.
Fig. 4.. Druggability of HilD and structural characterization of the HilD-C26 complex.
(A) HilD model with dsDNA generated by AlphaFold. DNA binding domain is highlighted in yellow, bound to a generic dsDNA fragment, whereas the β sheets of the cupin barrel are depicted in green. Dimerization interfaces are displayed in tones of blue and numbered accordingly. (B) Structural representation of the proposed binding mode from molecular modeling of pose 1 within the predicted binding pocket, generated by clustering the MD trajectory by the ligand RMSD variation. (C) Difference in HDX between C26-bound and apo HilD projected on its amino acid sequence. Different tones of blue or red reflect, respectively, a decrease or an increase in HDX in the presence of C26 (100 μM). The HilD secondary structure is schematically depicted above (red rectangles, α helices; black arrows, β strands). (D) Mapping of the regions exhibiting a lower (blue) or higher (red) deuterium incorporation in the presence of C26 (100 μM) as identified by HDX-MS. Zoom on the predicted binding pocket (left), and on the predicted DNA binding HTH-2 region (right). Relevant residues are shown as sticks. Binding pocket volume is depicted in an orange surface. (E) Whole-cell assay to monitor the sensitivity of HilD mutants to C26. Bacteria were treated with either DMSO (gray-filled circles, WT: black dotted line) or C26 (orange-filled circles, WT: orange dotted line). PhilA activation levels by the HilD mutants were calculated relative to HilDWT grown in DMSO 1%. Bonferroni’s multiple comparisons test was applied to compare treated and untreated conditions within each strain and compare the treated mutants to the treated WT condition (see Materials and Methods) (n ≥ 2 replicates, except HilDV273A for which N = 1 replicate). n.s., not significant; **P < 0.01; ****P < 0.0001 (Bonferroni’s multiple comparisons test). (F) EMSAs showing the binding of 600 nM HilDWT, HilDL45A, HilDY46A, HilDI100A, and HilDY212A to PhilA, upon incubation with the indicated concentrations of C26.
Fig. 5.
Fig. 5.. Spectrum of activity.
(A) Applied workflow for the identification of the most frequent amino acid substitutions in HilD among S. enterica. (B) Mutation rates of the 20 most frequent substitutions in 2351 sequences of HilD and their consequence on sensitivity to C26 (100 μM). Mutation rates are shown in gray bars (left y axis). HilD activity (right y axis) was quantified as in Fig. 4E. Bacteria were treated with either 1% DMSO (black dots) or 100 μM C26 (orange dots). (C) Activity of C26 (100 μM) on clinical strains of S. enterica isolated from human stool (brown), blood (purple), and urine (green) samples. 100% corresponds to SipA secretion in bacteria treated with 1% DMSO. (D) Activity of C26 (100 μM) on clinical strains of S. enterica isolates clustered by sequence type (ST). 100% corresponds to SipA secretion in bacteria treated with 1% DMSO. (E) Combination matrix (bottom) of the phenotypic antibiotic resistance profiles of S. Typhimurium clinical isolates (total = 42) and their corresponding sensitivity to C26 (100 μM) as monitored by quantification of SipA secretion (top). 100% corresponds to SipA secretion in bacteria treated with 1% DMSO. Each orange dot corresponds to a single clinical isolate. Trim./Sulfa., trimethoprim/sulfamethoxazole.
Fig. 6.
Fig. 6.. SAR analysis.
(A and B) Structures and activities of C26 and analogs. IC50 values were determined with the whole-cell HilD activity assay. Kd,app values correspond to the in vitro affinity determined by nanoDSF. TC50 values correspond to cytotoxicity determined with HeLa cells using the CellTox Green Cytotoxicity Assay. N = 3 replicates. (C) Quantification of C26 and SW-C182 in subcellular compartments of S. Typhimurium. Whole cell is the amount found in unfractionated bacteria. **P < 0.01; ***P < 0.001 (multiple paired t tests). N = 4 biological replicates.
Fig. 7.
Fig. 7.. Reagents and conditions for the synthesis of C26, SW-C165, and SW-C210.
(a) Boc2O, KOH, H2O/dioxane, r.t., overnight 57%; (b) iBuOCOCl, Et3N, THF, 0°C to r.t., 2 hours, then piperonylamine, r.t., 2 hours, 84%; (c) TFA, CH2Cl2, r.t., overnight, 72%; (d) R2CHO, HOAc, THF, r.t., 10 min, then NaBH(OAc)3, r.t., overnight.
Fig. 8.
Fig. 8.. Reagents and conditions for the synthesis of SW-C182, SW-C202, and SW-C250.
(a) 5-Bromothiophene-2-carbaldehyde, HOAc, THF, r.t., 10 min, then NaBH(OAc)3, r.t., overnight, 97%; (b) iBuOCOCl, Et3N, THF, 0°C to r.t., 2 hours, then R1CH2NH2, r.t., 2 hours; or R1CH2NH2, HATU, DIPEA, DMF.
Fig. 9.
Fig. 9.. Reagents and conditions for the synthesis of SW-C170.
(a) iBuOCOCl, Et3N, THF, 0°C to r.t., 2 hours, then (HO)2C6H3CH2NH2, r.t., 2 hours, 42%; (b) TFA, CH2Cl2, r.t., 5 hours; (c) 2-bromo-5-(bromomethyl)thiophene, Et3N, THF, 16 hours, 68% over two steps.

References

    1. Antimicrobial Resistance Collaborators , Global burden of bacterial antimicrobial resistance in 2019: A systematic analysis. Lancet 399, 629–655 (2022). - PMC - PubMed
    1. Dickey S. W., Cheung G. Y. C., Otto M., Different drugs for bad bugs: Antivirulence strategies in the age of antibiotic resistance. Nat. Rev. Drug Discov. 16, 457–471 (2017). - PMC - PubMed
    1. Rex J. H., Fernandez Lynch H., Cohen I. G., Darrow J. J., Outterson K., Designing development programs for non-traditional antibacterial agents. Nat. Commun. 10, 3416 (2019). - PMC - PubMed
    1. Theuretzbacher U., Piddock L. J. V., Non-traditional antibacterial therapeutic options and challenges. Cell Host Microbe 26, 61–72 (2019). - PubMed
    1. Allen R. C., Popat R., Diggle S. P., Brown S. P., Targeting virulence: Can we make evolution-proof drugs? Nat. Rev. Microbiol. 12, 300–308 (2014). - PubMed

MeSH terms

LinkOut - more resources