. 2025 Apr 11;11(15):eadt6159.
doi: 10.1126/sciadv.adt6159. Epub 2025 Apr 11.

The cohesin-associated protein Pds5A governs the meiotic spindle assembly via deubiquitination of Kif5B in oocytes

Affiliations

The cohesin-associated protein Pds5A governs the meiotic spindle assembly via deubiquitination of Kif5B in oocytes

Yu Zhang et al. Sci Adv. .

Abstract

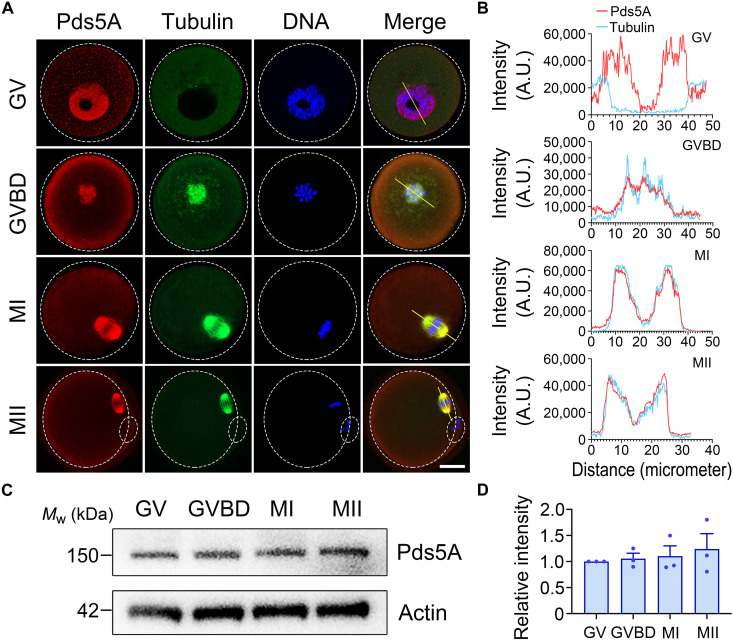
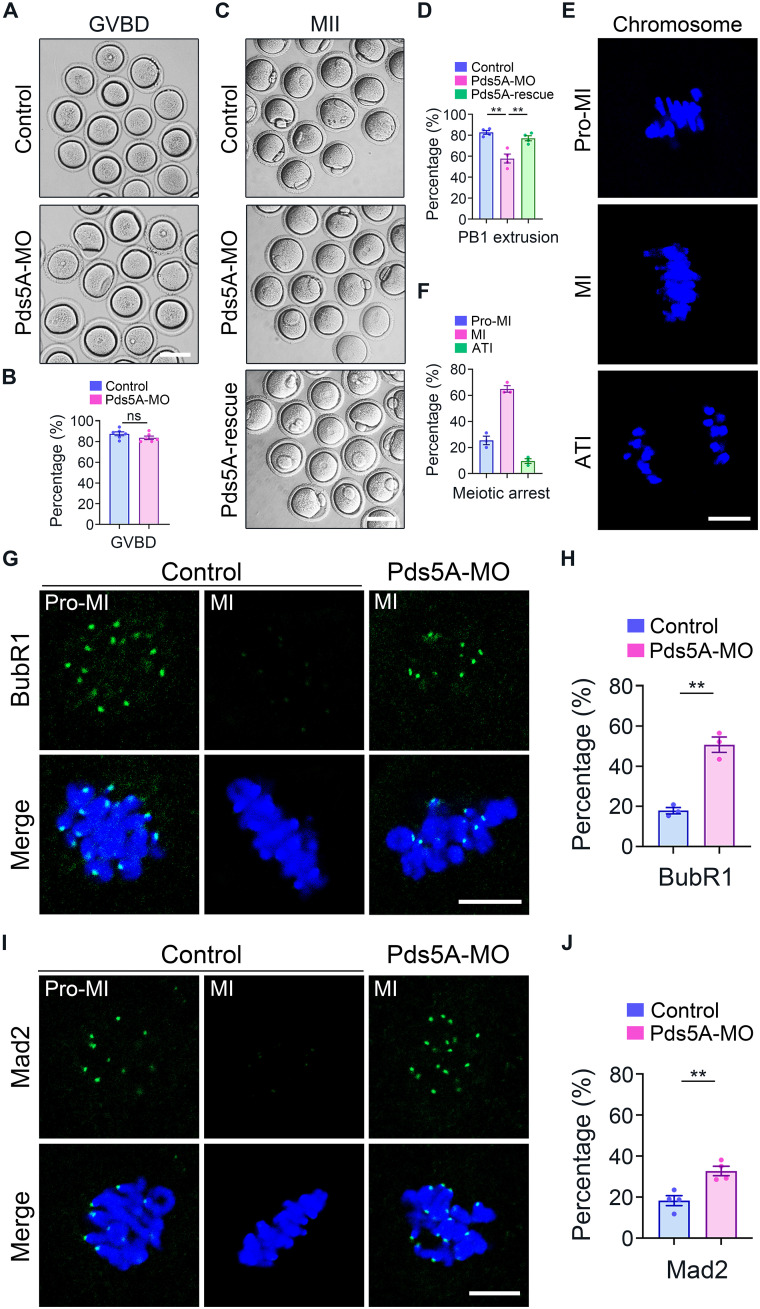
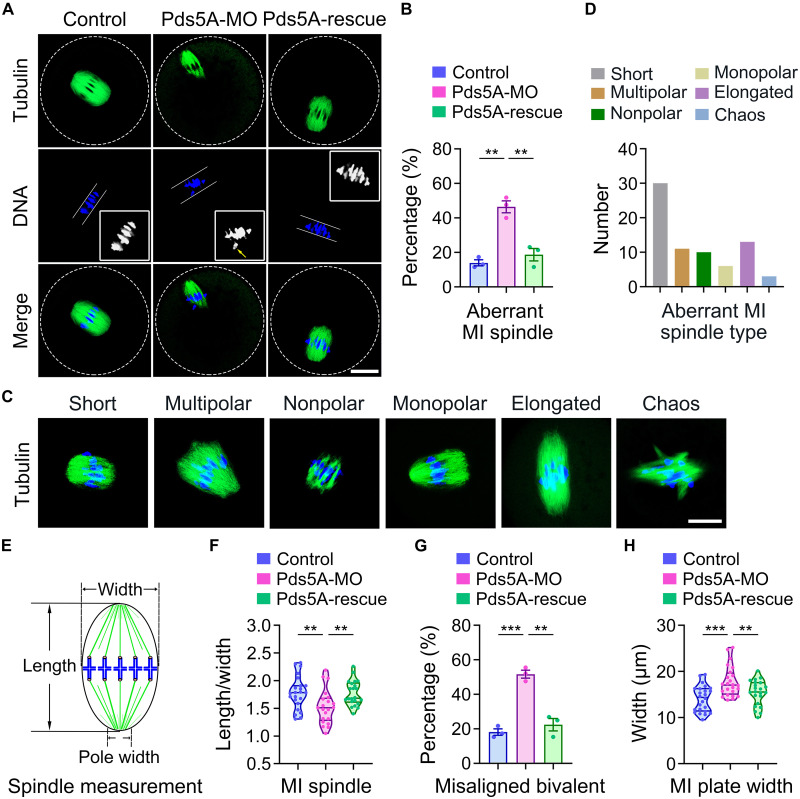
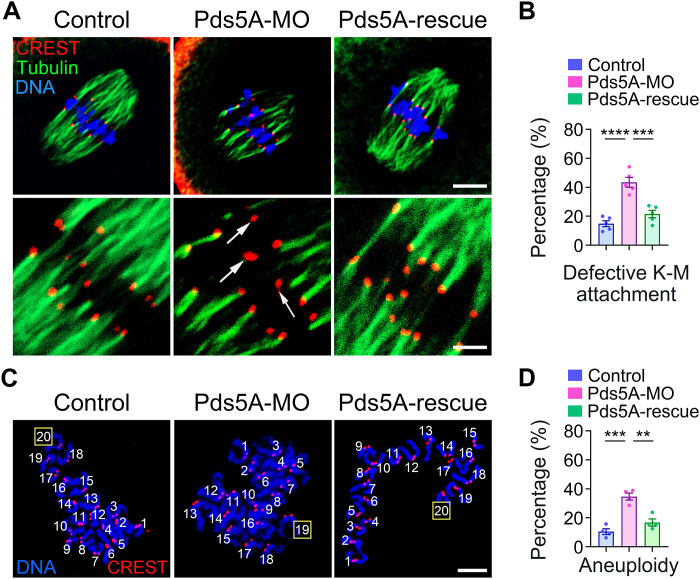
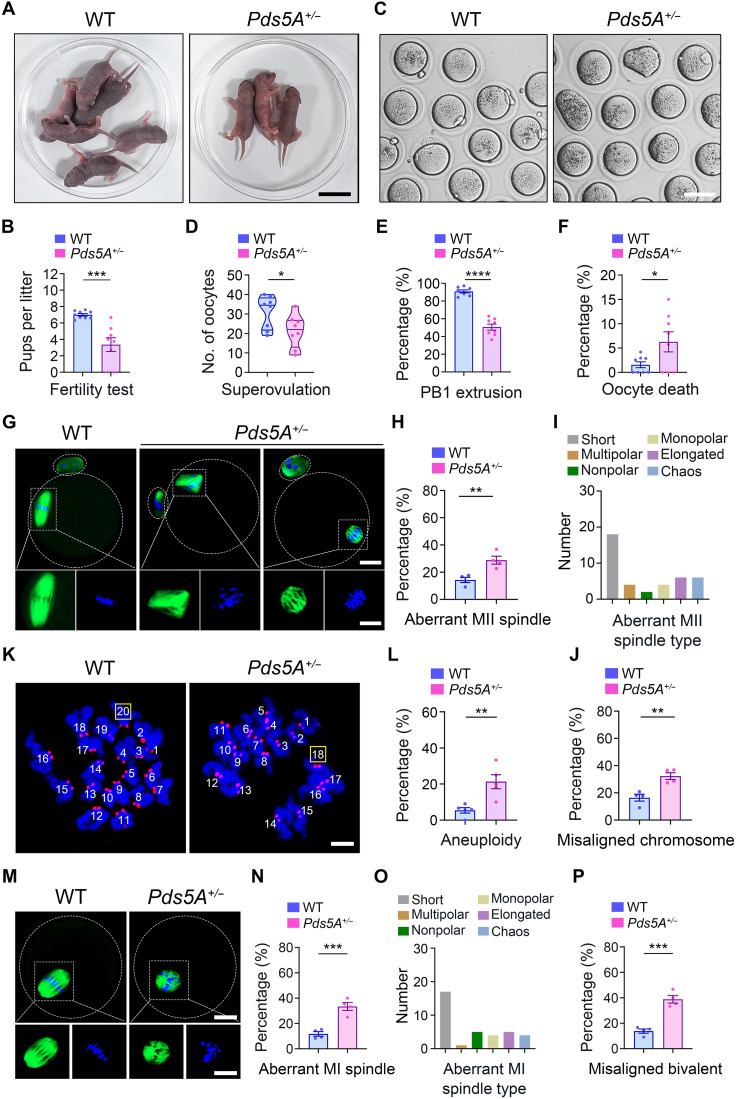
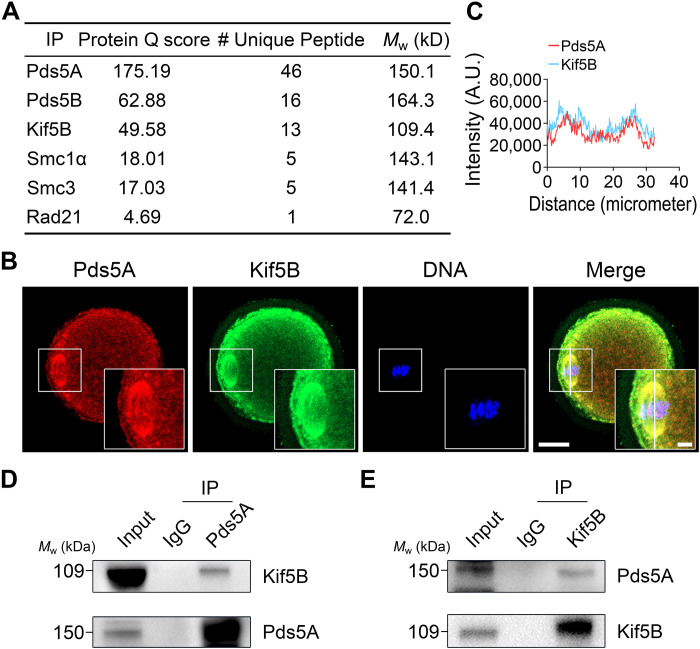
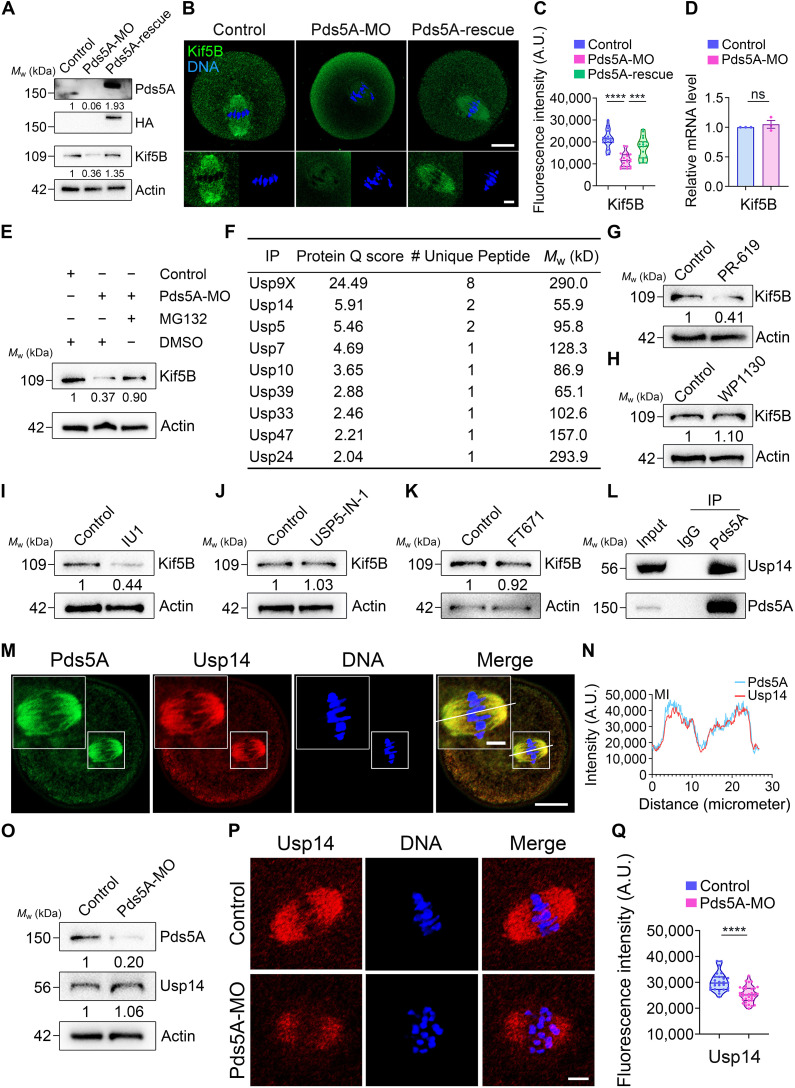
Chromosome cohesion mediated by cohesin complex and its associated proteins is required for accurate chromosome segregation and genomic stability in mitosis. However, because of the distinct operation mechanisms, many proteins might exert different functions during meiosis in germ cells. Here, we document that cohesin-associated protein precocious dissociation of sisters 5A (Pds5A) plays a noncanonical role in the meiotic spindle assembly during oocyte maturation independent of its cohesion function. Pds5A distributes on the spindle fibers in oocytes at both metaphase I and metaphase II stages. Morpholino-based depletion or genetic ablation of Pds5A all lead to defects in spindle organization, chromosome euploidy and meiotic progression in oocytes and thus compromising the female fertility. Mechanistically, Pds5A recruits deubiquitinase ubiquitin-specific protease 14 to the spindle apparatus for stabilization of kinesin family member 5B, regulating the spindle elongation. Collectively, our findings unveil that cohesin-associated protein Pds5A can be used as a spindle regulator during oocyte meiosis.


Figures

Fig. 1.
Fig. 1.. Subcellular localization and protein expression patterns of Pds5A during mouse oocyte meiotic maturation.
(A) Fluorescence images of Pds5A localization in oocytes. Mouse oocytes at different developmental stages were costained with Pds5A (Santa Cruz Biotechnology) and α-tubulin antibodies and counterstained with Hoechst 33342. Scale bar, 20 μm. (B) Fluorescence intensity profiles of Pds5A and α-tubulin along the yellow line in (A). (C) Immunoblotting analysis of Pds5A protein levels during oocyte meiosis corresponding to GV, GVBD, MI, and MII stages. The blots were probed with Pds5A (Proteintech) and β-actin antibodies, respectively. (D) Quantification of Pds5A protein levels during oocyte meiosis. The band intensity of Pds5A was normalized with that of β-actin. A.U., arbitrary unit.
Fig. 2.
Fig. 2.. Effects of Pds5A depletion on the mouse oocyte meiotic progression.
(A) Representative images of GVBD oocytes observed at 4 hours following release from 3-isobutyl-1-metyl-xanthine in control and Pds5A-MO groups. Scale bar, 80 μm. (B) The rate of GVBD in control (n = 169) and Pds5A-MO (n = 185) oocytes. (C) Representative images of MII oocytes observed at 10 hours post-GVBD in control, Pds5A-MO, and Pds5A-rescue (Pds5A-MO + Pds5A-cRNA) groups. Scale bar, 80 μm. (D) The rate of PBE in control (n = 119), Pds5A-MO (n = 119), and Pds5A-rescue (n = 113) oocytes. (E) Representative images of chromosome morphology in Pds5A-MO oocytes without PB1 after maturation. Scale bar, 5 μm. (F) The percentage of oocytes arresting at different developmental stages in Pds5A-MO (n = 76) group. (G) Fluorescence images of BubR1 present on the chromosomes in control and Pds5A-MO oocytes at Pro-MI and MI stages. Scale bar, 5 μm. (H) The proportion of BubR1 presence on the chromosomes in control (n = 73) and Pds5A-MO (n = 69) oocytes at MI stage. (I) Fluorescence images of Mad2 present on the chromosomes in control and Pds5A-MO oocytes at Pro-MI and MI stages. Scale bar, 5 μm. (J) The proportion of Mad2 presence on the chromosomes in control (n = 71) and Pds5A-MO (n = 86) oocytes at MI stage. Data in (B), (D), (F), (H), and (J) were designated as mean percentage (means ± SEM) of at least three independent experiments. **P < 0.01; ns, no significance.
Fig. 3.
Fig. 3.. Effects of Pds5A depletion on the spindle organization and chromosome alignment in mouse oocytes.
(A) Fluorescence images of spindle morphology and chromosome alignment in control, Pds5A-MO, and Pds5A-rescue oocytes at MI stage. The yellow arrow points to the misaligned chromosomes. Scale bar, 20 μm. (B) The rate of abnormal spindles in control (n = 72), Pds5A-MO (n = 73), and Pds5A-rescue (n = 80) oocytes at MI stage. (C) Representative images showing different types of spindle defects observed in Pds5A-MO oocytes at MI stage. Scale bar, 10 μm. (D) The number of different types of spindle defects in Pds5A-MO (n = 73) oocytes at MI stage. (E) Schematic picture showing how the spindle length, width, and pole width were determined. (F) The ratio of spindle length to width in control (n = 23), Pds5A-MO (n = 21), and Pds5A-rescue (n = 22) oocytes at MI stage. (G) The rate of misaligned bivalents in control (n = 72), Pds5A-MO (n = 73), and Pds5A-rescue (n = 80) oocytes at MI stage. (H) Quantification of MI plate width in control (n = 24), Pds5A-MO (n = 24), and Pds5A-rescue (n = 22) oocytes at MI stage. Data in (B) and (G) were designated as mean percentage (means ± SEM), and (F) and (H) were designated as mean value (means ± SD) of at least three independent experiments. **P < 0.01; ***P < 0.001.
Fig. 4.
Fig. 4.. Effects of Pds5A depletion on the K-M attachment and chromosome ploidy in mouse oocytes.
(A) Fluorescence images kinetochores and microtubule fibers in control, Pds5A-MO, and Pds5A-rescue oocytes at MI stage. White arrows indicate unattached kinetochores. Scale bars, 5 and 2.5 μm. (B) The percentage of unattached kinetochores in control (n = 90), Pds5A-MO, (n = 125), and Pds5A-rescue (n = 103) oocytes at MI stage. (C) Representative images of chromosome spreads in control, Pds5A-MO, and Pds5A-rescue oocytes at MII stage. Scale bar, 8 μm. (D) The percentage of aneuploid oocytes at MII stage in control (n = 76), Pds5A-MO (n = 78), and Pds5A-rescue (n = 76) groups. Data in (B) and (D) were designated as mean percentage (means ± SEM) of at least three independent experiments. **P < 0.01; ***P < 0.001; ****P < 0.0001.
Fig. 5.
Fig. 5.. The oocyte maturation and female fertility in Pds5A+/− mice.
(A) Representative images of pups from WT and Pds5A+/− female mice. Scale bar, 1 cm. (B) The average number of pups per litter from WT (n = 9) and Pds5A+/− (n = 8) female mice. (C) Representative images of superovulated oocytes from WT and Pds5A+/− female mice. Scale bar, 80 μm. (D to F) The number, PBE rate, and death rate of superovulated oocytes in WT (n = 248) and Pds5A+/− (n = 173) groups. (G) Fluorescence images of spindles and chromosomes in WT and Pds5A+/− superovulated oocytes. Scale bars, 20 and 10 μm. (H) The rate of abnormal spindles in WT (n = 85) and Pds5A+/− (n = 84) superovulated oocytes. (I) The number of different defective spindles in Pds5A+/− (n = 40) superovulated oocytes. (J) The rate of misaligned chromosomes in WT (n = 85) and Pds5A+/− (n = 84) superovulated oocytes. (K) Representative images of chromosome spreads in WT and Pds5A+/− superovulated oocytes. Scale bar, 10 μm. (L) The percentage of aneuploid oocytes in WT (n = 84) and Pds5A+/− (n = 57) groups. (M) Fluorescence images of spindles and chromosomes in WT and Pds5A+/− MI oocytes. Scale bar, 20 μm. (N) The rate of abnormal spindles in WT (n = 100) and Pds5A+/− (n = 118) MI oocytes. (O) The number of different defective spindles in Pds5A+/− (n = 36) MI oocytes. (P) The rate of misaligned bivalents in WT (n = 100) and Pds5A+/− (n = 118) MI oocytes. Data in (B) and (D) were designated as means ± SD, and (E), (F), (H), (J), (L), (N), and (P) were designated as means ± SEM of at least three independent experiments. *P < 0.05; **P < 0.01; ***P < 0.001; ****P < 0.0001.
Fig. 6.
Fig. 6.. Identification of binding partners of Pds5A.
(A) Representative binding candidates of Pds5A as shown in MS data. (B) Costaining of Pds5A and Kif5B in oocytes at MI stage. Scale bars, 20 and 5 μm. (C) Fluorescence intensity profiles of Pds5A and Kif5B along the white line. (D) Co-IP of Pds5A and Kif5B as precipitated with Pds5A antibody. The blots of precipitates were probed with Kif5B and Pds5A antibodies, respectively. (E) Co-IP of Pds5A and Kif5B as precipitated with Kif5B antibody. The blots of precipitates were probed with Pds5A and Kif5B antibodies, respectively.
Fig. 7.
Fig. 7.. Recruitment of Usp14 by Pds5A stabilizes Kif5B in mouse oocytes.
(A) Immunoblotting analysis showing the protein levels of Kif5B in control, Pds5A-MO, and Pds5A-rescue oocytes. (B) Fluorescence images of Kif5B in control, Pds5A-MO, and Pds5A-rescue oocytes at MI stage. Scale bars, 20 and 5 μm. (C) The fluorescence intensity of Kif5B signals in control (n = 19), Pds5A-MO (n = 20), and Pds5A-rescue (n = 19) oocytes at MI stage. (D) qRT-PCR analysis showing the mRNA levels of Kif5B in control (n = 30) and Pds5A-MO (n = 30) oocytes. (E) Immunoblotting analysis showing the protein levels of Kif5B in control, Pds5A-MO, and Pds5A-MO+MG132 (10 μM) oocytes. (F) Representative binding DUBs of Pds5A as shown in MS data. (G to K) Immunoblotting analysis showing the protein levels of Kif5B in control, PR-619-treated, WP1130-treated, IU1-treated, USP5-IN-1-treated, and FT671-treated oocytes, respectively. PR-619 (10 μM), 10 μM WP1130, 25 μM IU1, 10 μM USP5-IN-1, and 10 μM FT671 were used to treat GV oocytes for 22 hours, respectively. (L) Co-IP of Pds5A and Usp14 as precipitated with Pds5A antibody. (M) Costaining of Pds5A and Usp14 in oocytes at MI stage. Scale bars, 20 and 5 μm. (N) Fluorescence intensity profiles of Pds5A and Usp14 along the white line in (M). (O) Immunoblotting analysis showing the protein levels of Usp14 in control and Pds5A-MO oocytes. (P) Fluorescence images of Usp14 in control and Pds5A-MO oocytes at MI stage. Scale bar, 5 μm. (Q) The fluorescence intensity of Usp14 signals in control (n = 26) and Pds5A-MO (n = 35) oocytes at MI stage. Data in (D) were designated as mean percentage (means ± SEM), and (C) and (Q) were designated as mean value (means ± SD) of at least three independent experiments. ***P < 0.001; ****P < 0.0001; ns, no significance.

Similar articles

References

    1. Xiong B., Gerton J. L., Regulators of the cohesin network. Annu. Rev. Biochem. 79, 131–153 (2010). - PubMed
    1. Makrantoni V., Marston A. L., Cohesin and chromosome segregation. Curr. Biol. 28, R688–R693 (2018). - PMC - PubMed
    1. Ishiguro K.-i., Watanabe Y., Chromosome cohesion in mitosis and meiosis. J. Cell Sci. 120, 367–369 (2007). - PubMed
    1. Hirano T., Chromosome cohesion, condensation, and separation. Annu. Rev. Biochem. 69, 115–144 (2000). - PubMed
    1. Peters J.-M., Tedeschi A., Schmitz J., The cohesin complex and its roles in chromosome biology. Genes Dev. 22, 3089–3114 (2008). - PubMed