. 2025 Apr 11;10(106):eads0519.
doi: 10.1126/sciimmunol.ads0519. Epub 2025 Apr 11.

Psychological stress increases skin infection through the action of TGFβ to suppress immune-acting fibroblasts

Affiliations

Psychological stress increases skin infection through the action of TGFβ to suppress immune-acting fibroblasts

Hung Chan et al. Sci Immunol. .

Abstract

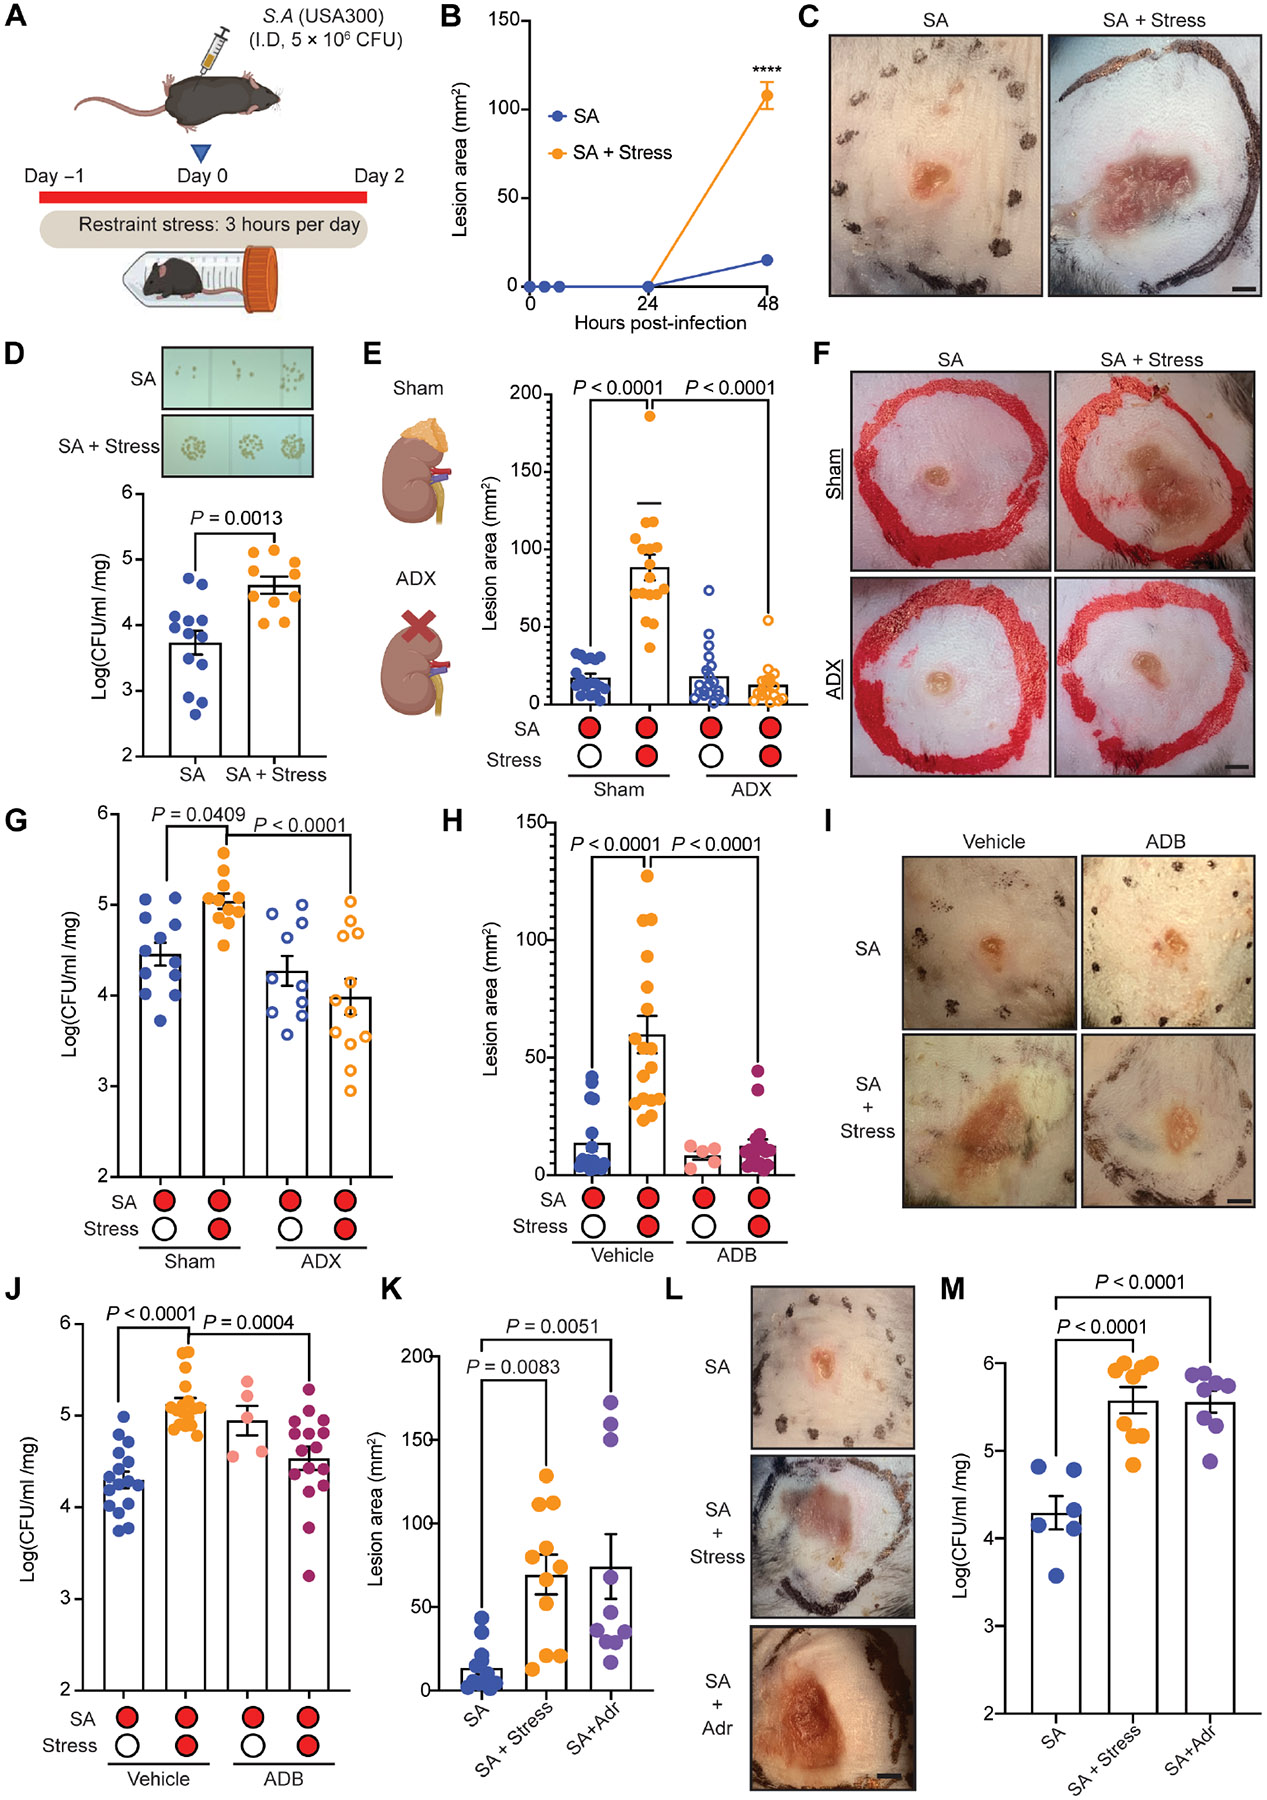
Infections after psychological stress are a major health care problem. Single-cell transcriptomics and lipidomic profiling in a mouse model of stress show that dermal fibroblasts undergoing adipogenesis have defective responses to Staphylococcus aureus skin infection. Adrenalectomy or adrenergic inhibition restores the fibroblast adipogenic response to S. aureus and enables mice to effectively resist infection during stress. Increased susceptibility to S. aureus from stress is attributed to suppression of the antimicrobial peptide cathelicidin (Camp) because adrenaline directly inhibits Camp production by fibroblasts, and mice lacking Camp in fibroblasts do not increase infection after stress. Transforming growth factor β (TGFβ) is induced by stress and adrenergic signaling, and inhibition of TGFβ or deletion of the TGFβ receptor on fibroblasts increases Camp expression and restores protection against infection. Together, these data show that stress initiates a brain-skin axis mediated by TGFβ that impairs the immune defense function of dermal fibroblasts to produce the Camp antimicrobial peptide.


Figures

Fig. 1.
Fig. 1.. Psychological stress exacerbates skin infection by SA.
(A) Schematic of the experimental stress model by restraint and SA infection. SA was injected immediately before restraint on day 0. (B) SA lesion size was measured at different time points after injection in the absence or presence of psychological stress (n = 22 or 23 lesions from 11 or 12 mice for each condition at day 2). ****P < 0.0001. (C) Representative photograph of lesions from day 2 after SA injection. Scale bar, 1.5 mm. (D) Image of SA colony growth on agar and quantification of CFU/ml per mg of skin tissue (n = 10 to 13 lesions for each condition). (E) Illustration of surgical ADX. Measurements of SA lesion size on day 2 after SA injection and 9 days after sham operation or ADX mice (n = 17 to 19 lesions from 9 or 10 mice for each condition). (F) Representative photograph of skin lesions from sham-operated mice or ADX mice 2 days after SA infection. Scale bar, 1.5 mm. (G) SA CFU in skin tissue at day 2 from sham-operated mice or ADX mice in the absence or presence of psychological stress (n = 10 to 12 lesions for each condition). (H) Lesion size of SA-infected mice with or without psychological stress after pretreatment with adrenergic receptor blockers (ADBs) or vehicle in (n = 5 to 17 lesions from three to nine mice for each condition). (I) Representative photograph of lesions from (H). Scale bar, 1.5 mm. (J) SA CFU in skin tissue from experiments shown in (H) (n = 5 to 17 lesions from three to nine mice for each condition). (K) Comparison of 2-day SA lesion size after psychological stress or intradermal injection of adrenaline (Adr) (1.6 mg/kg daily) starting from day −1 to day 2. (n = 10 to 12 lesions from five or six mice). (L) Representative photograph of lesions from (K). Scale bar, 1.5 mm. (M) SA CFU in skin tissue from experiments shown in (K) (n = 6 to 9 lesions for each condition). Results in all panels are represented as means ± SEM from two or more independent experiments. Significance was calculated using a one-way ANOVA (three or more group comparisons).
Fig. 2.
Fig. 2.. The suppression of lipid-related host defense mechanisms is linked to the exacerbation of SA infection triggered by psychological stress.
(A) Bulk RNA-seq workflow for mouse skin 2 days after SA infection, sham operation, or ADX with or without stress. (B) PCA of the normalized bulk RNA-seq data for (A) (n = 3 for each condition). (C) Volcano plot of differentially expressed genes in perilesional skin biopsies from sham-operated mice infected with SA alone versus SA-infected controls with stress. (D) Pairwise comparison of GSEA using the Hallmark adipogenesis pathway from bulk RNA-seq data. The comparisons include Sham_ SA + stress versus Sham_ SA and ADX_ SA + stress versus ADX_SA + stress. (E) Histological images of hematoxylin and eosin (H&E) staining of skin samples collected 2 days after SA infection and stress or Adr administration. Adipose tissues are marked with dashed lines (images are representative of n = 6 per group). Scale bar, 300 μm. (F) Quantification of adipose tissue thickness shown in (E) (n = 4 per group). (G) Bodipy staining of lipid in skin samples collected 2 days after SA infection and stress or Adr administration. Nuclei were stained by DAPI (blue). (representative of n = 6 per group). Scale bar, 300 μm. (H) Quantification of the mean intensity of lipid droplets in (G) (n = 333 for control; n = 685 for stress; n = 623 for SA; n = 713 for SA with stress; n = 361 for SA with Adr administration). (I) PCA of lipidomic data from dermises of SA-infected mice or vehicle-injected mice in the absence or presence of psychological stress (n = 3 for each condition). The percentage of total variance explained by individual principal components (PC1 and PC2) is indicated. (J) Box plot of triglyceride abundance in tissues from (I). (K) Box plot of free fatty acid in tissues from (I). Significance was calculated using a one-way ANOVA (three or more group comparisons). A.U., arbitrary unit.
Fig. 3.
Fig. 3.. Psychological stress alters fibroblast gene expression.
(A) t-SNE plot of all high-quality cells profiled from pooled dorsal mouse skin 2 days after SA infection and mock infections with or without restraint stress (n = 3 animals per condition). A post–quality control analysis identified 5969 cells from mock-infected skin, 5201 cells from mock-infected skin with stress, 3678 cells from SA-infected skin, and 1112 cells from SA-infected skin with stress. (B) Heatmap of the canonical and curated marker genes for major cell lineages. (C) Bar plot demonstrating top five pathways enriched in SA with stress versus SA by GSVA. t values were calculated by limma regression. (D) Number of differentially expressed genes (DEGs) in each cell type in stressed and control skin with or without SA infection (Poisson test, adjusted P value of <0.05). (E) Illustration representing the number of genes that were either up-regulated or down-regulated in fibroblasts under stress conditions compared with the control group. Enrichment analysis (P value < 0.05 and fold change > 0.25) was conducted for GO biological processes and pathways in the Reactome pathway database, focusing on the genes that exhibited up-regulation or down-regulation in fibroblasts.
Fig. 4.
Fig. 4.. Psychological stress exacerbates SA infection via suppression of cathelicidin.
(A) Gene expression based on qPCR analysis for AMPs (α-defensin, β-defensin, and Camp) of whole skin at day 2 with and without SA infection and with or without stress or ADX (three to six per each condition). (B) Time course of Camp expression after SA infection with or without stress (three to six per each condition). *P < 0.05. (C) Immunohistochemical images of perilesional skin showing CRAMP protein expression (red) and fibroblasts (PDGFRA; green) 2 days after SA infection or SA with stress (representative of n = 3 per each condition). Scale bar, 300 μm. (D) Immunohistochemical images of perilesional skin showing CRAMP protein expression (red) and neutrophils (GR1; green) 2 days after SA infection or SA with stress (representative of n = 3 per each condition; large box is costained images, and small boxes show individual stains). Scale bar, 300 μm. (E) Protein immunoblot of mouse cathelicidin (CRAMP) and actin from skin 2 days after SA infection, SA infection with stress, or these conditions after ADX. (F) Flow cytometry plots for Ly6G and CD11b in the skin at 3 hours postinfection of SA-infected mice with and without stress (n = 3 per group). (G) Qualification of the percentage of neutrophils from (F) (gated as viable CD45+Ly6G+CD11b+cells). (H) Whole-blood mouse mRNA expression of AMP Camp in SA infection with or without psychological stress at day 2 (n = 5 per each condition). (I) Whole-blood killing activity against SA in blood from mice with or without psychological stress at day 2 after infection (n = 5 per each condition). (J) Effect of chemical neutropenia on the response to stress as measured by SA CFU/ml per mg of tissue (n = 4 mice for each condition). Results in all panels are represented as means ± SEM from two or more independent experiments. Significance was calculated using a one-way ANOVA (three or more group comparisons) or unpaired Student’s t test (two groups).
Fig. 5.
Fig. 5.. Adrenaline inhibits cathelicidin expression by preadipocytes.
(A) PCA of normalized bulk RNA-seq data for mdFBs or HPAds treated with Adr or adipocyte differentiation medium (ADM) in the absence or presence of Adr (n = 3 per group). (B) Enrichment analysis of HALLMARK database (false discovery rate < 0.05) of related pathways under the indicated conditions. (C) Heatmap display of qPCR results for the expression of genes involved in adipogenesis by mouse fibroblasts (3T3L1 and mdFB) in response to adipocyte differentiation medium in the presence or absence of Adr for 2 days in comparison with control (representative of n = 3 per group). (D) Camp expression in HPAds with adipocyte differentiation medium in the presence or absence of various concentrations of Adr (n = 3 per each condition). (E) Representative CAMP staining (red) and DAPI (blue) in HPAd and 3T3L1 cells grown in adipocyte differentiation medium in the presence or absence of Adr. Scale bar, 5 μM (representative of n = 3 per group). (F) Bacterial growth on agar plate and CFUs of SA ΔmprF after 48-hour exposure to conditioned medium from preadipocytes treated with Adr as indicated (n = 5 per each condition). (G) Comparison of 2-day SA lesion size from PdgfraWT mice or PdgfraΔCamp mice in the absence or presence of stress (n = 8 to 14 lesions from four to seven mice for each condition). (H) Representative photograph of lesions from (G). Scale bar, 1.5 mm. (I) SA CFU in skin tissue from experiments shown in (G) (8 to 14 lesions from four to seven mice for each condition). Results in all panels are represented as means ± SEM from two or more independent experiments. Significance was calculated using a one-way ANOVA (three or more group comparisons); ns, not significant.
Fig. 6.
Fig. 6.. Psychological stress induces TGFβ expression and activates the TGFβ pathway in dermal fibroblasts.
(A) Analysis of scRNA-seq data for signaling pathways underlying interactions of all cells isolated from mouse skin after stress compared with control. (B) Measurement of plasma concentrations of TGFβ1 or TGFβ2 in mice for the indicated group (n = 4 or 5 per each condition). (C) qPCR analysis of mRNA in skin for Tgfb1, Tgfb3, Ccn2/Ctgf, Spp1, and Il6 in the indicated groups (n = 3 to 5 mice for each condition). (D) Immunohistochemical staining of skin with pan-TGFβ (red) and PDGFRA (green) antibodies under the indicated condition (representative of n = 3 per each condition). Nuclei were counterstained with DAPI (blue). The lower row is an enlarged image from the area indicated by a dotted white line. Scale bars, 300 μm and 50 μm (enlarged). (E) Violin plots showing the expression of the Tgfb1, Tgfb2, Tgfb3, Tgfbr1, Acvr1b, Acvr1, andTgfbr2 genes in all clusters in the context of SA infection with or without stress. (F) Average log2 fold change expression of significantly regulated genes in SA-infected plus stress compared with SA-infected and stress compared with control in Pdgfra + fibroblasts. (G) Heatmap showing relative mRNA expression (based on RT-qPCR and relative to control condition) of TGFβ isoforms in mdFB, 3T3L1, and HPAd preadipocytes with ADM in the presence or absence of Adr (n = 3 for each condition). (H) Representative TGFβ1 staining in 3T3L1 treated with adipocyte differentiation medium in the presence or absence of Adr. Nuclei were counterstained with DAPI (blue). Scale bar, 750 μm. Results in all panels are shown as means ± SEM from two or more independent experiments. Significance was calculated using a one-way ANOVA (three or more group comparisons).
Fig. 7.
Fig. 7.. Inhibition of TGFβ pathway function restores resistance to SA infection during psychological stress.
(A) Schematic illustration of experimental design assessing pan-TGFβ–neutralizing antibody and TGFβ receptor inhibitor (TGFβRi) during stress and SA infection. (B) SA lesion size measured at day 2 after SA injection with or without stress or pan-TGFβ–neutralizing antibody with stress (n = 4 to 9 lesions from three to five mice for each condition). (C) Representative photograph of lesions from (B). Scale bar, 1.5 mm. (D) SA lesion size measured at day 2 after SA injection with or without stress or pretreatment with TGFβ receptor inhibitor plus stress (n = 12 or 13 lesions from six or seven mice for each condition). (E) Representative photograph of lesions from (D). Scale bar, 1.5 mm. (F) SA CFU in skin tissue from experiments shown in (B) (n = 4 to 7 lesions from four mice for each condition). (G) SA CFU in skin tissue from experiments shown in (D) (n = 6 to 8 lesions from three or four mice for each condition). (H) Skin biopsies at day 2 after SA infection were collected for H&E staining as indicated. Adipose layer is marked with dashed lines (representative of n = 3 per group). Scale bar, 300 μm. (I) Quantification of adipose tissue thickness shown in (H) (n = 4 per group). (J) Bodipy staining for lipid in skin at day 2 as indicated (representative of n = 3 per group). Nuclei were stained by DAPI (blue). Scale bar, 300 μm. (K) Quantification of the mean intensity of lipid droplets in (J) (n = 466 for SA; n = 398 for SA with stress; n = 698 for SA with stress plus pan-TGFβ–neutralizing antibody). (L) Comparison of 2-day SA lesion size from PdgfraWT mice or PdgfraΔTgfbr2 mice in the absence or presence of stress (n = 5 to 12 lesions from three to six mice for each condition). (M) Representative photograph of lesions from (L). Scale bar, 1.5 mm. (N) SA CFU in skin tissue from experiments shown in (L) (5 to 12 lesions from three to six mice for each condition). Results in all panels are represented as means ± SEM from two or more independent experiments. Significance was calculated using a one-way ANOVA (three or more group comparisons).

Similar articles

References

    1. Barsotti N, Chiera M, Lanaro D, Fioranelli M, Impact of stress, immunity, and signals from endocrine and nervous system on fascia. Front. Biosci 13, 1–36 (2021). - PubMed
    1. Rojas I-G, Padgett DA, Sheridan JF, Marucha PT, Stress-induced susceptibility to bacterial infection during cutaneous wound healing. Brain Behav. Immun 16, 74–84 (2002). - PubMed
    1. Herman JP, McKlveen JM, Ghosal S, Kopp B, Wulsin A, Makinson R, Scheimann J, Myers B, Regulation of the hypothalamic-pituitary-adrenocortical stress response. Compr. Physiol 6, 603–621 (2016). - PMC - PubMed
    1. Lowrance SA, Ionadi A, McKay E, Douglas X, Johnson JD, Sympathetic nervous system contributes to enhanced corticosterone levels following chronic stress. Psychoneuroendocrinology 68, 163–170 (2016). - PMC - PubMed
    1. Seals DR, Esler MD, Human ageing and the sympathoadrenal system. J. Physiol 528, 407–417 (2000). - PMC - PubMed

Publication types

Substances