. 2025 May:82:103632.
doi: 10.1016/j.redox.2025.103632. Epub 2025 Apr 8.

Particulate matter exposure induces pulmonary TH2 responses and oxidative stress-mediated NRF2 activation in mice

Affiliations

Particulate matter exposure induces pulmonary TH2 responses and oxidative stress-mediated NRF2 activation in mice

Yuna Jo et al. Redox Biol. 2025 May.

Abstract

Introduction: Particulate matter (PM) is a harmful air pollutant associated with respiratory and cardiovascular diseases, but its effects on adaptive immunity are poorly understood.

Objectives: This study investigates the role of NRF2 in T cells in mediating immune and pulmonary responses to long-term PM exposure, highlighting its impact on inhalation toxicity.

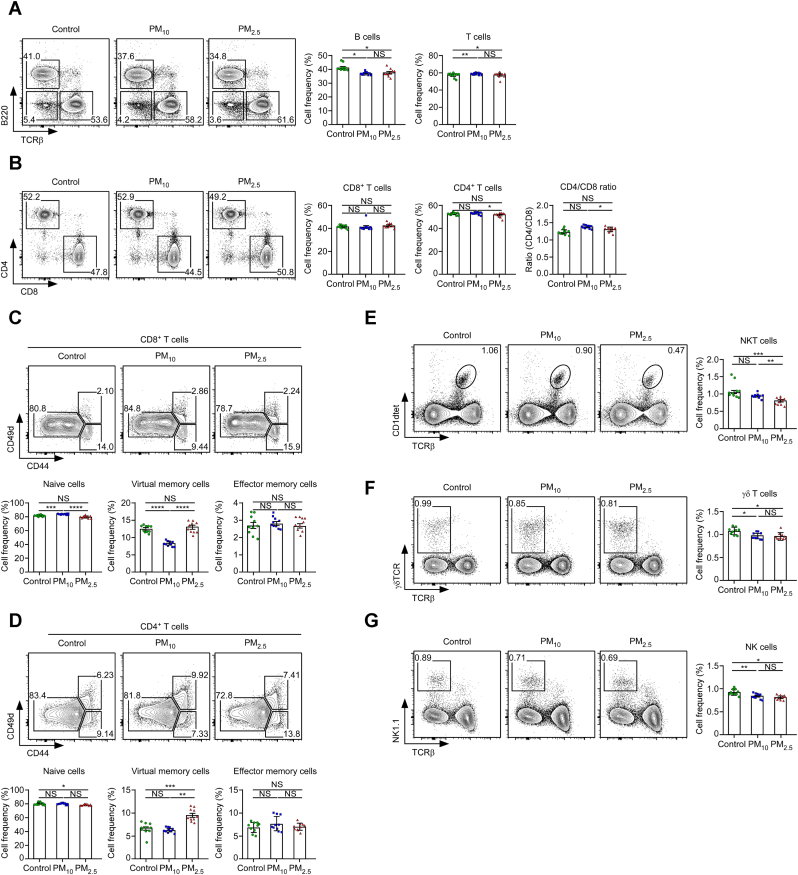
Methods: To establish a mouse model of lung injury induced by PM exposure, C57BL/6 mice were intranasally administered 20 μg/kg PM10 or PM2.5 daily for 16 weeks. Lung injury parameters were analyzed in bronchoalveolar lavage fluid (BALF), plasma, and lung tissue. Changes in the proportion of immune cells in the lymph nodes and spleen were analyzed.

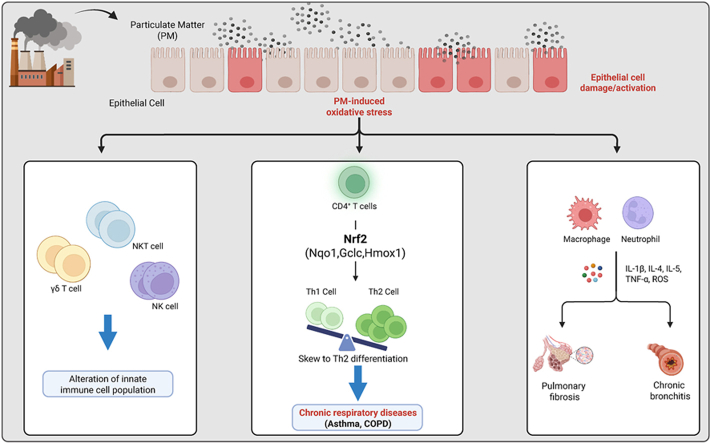
Results: Mice exposed to PM for 16 weeks showed severe lung damage, such as inflammatory cell infiltration, thickened alveolar walls, and increased oxidative stress and apoptosis. PM exposure also increased collagen and fibronectin levels, indicating tissue remodeling. Immune cell analysis revealed reduced B cell expansion, increased IL-4-producing CD4+ T cells, and decreased IFN-γ- and TNF-α-producing CD4+ T cells, accompanied by higher TH2 cytokines and plasma IgE and IgG1 levels. PM activated the NRF2 pathway, skewing immune responses toward TH2 differentiation, which worsened lung inflammation.

Conclusions: These findings highlight how PM exposure disrupts immune balance and exacerbates conditions like asthma and chronic obstructive pulmonary disease by promoting TH2-driven inflammation through NRF2 activation.

Keywords: NRF2; Oxidative stress; Particulate matter; Th2 immunity.


Conflict of interest statement

Declaration of competing interest The authors have declared no conflict of interest.

Figures

Image 1
Graphical abstract
Fig. 1
Fig. 1
PM exposure results in pulmonary injury in mice. (A) Schematic of establishment of PM-induced lung injury mouse model. Male C57BL/6 mice (6 weeks old) were treated with 20 μg/kg PM10 or PM2.5 in 20 μL PBS daily via intranasal instillation (i.n.) for four months; control mice were treated with PBS. (B) Total body weight measured at the end of the 4-month exposure period. (C) Gross morphology of the mouse lung. (D) H&E staining of the lung tissues; yellow and green arrows: macrophage and lymphocyte infiltration, respectively; red arrows: PM particle penetration into the lung tissues. The dashed-line boxes delineate regions of interest characterized by prominent infiltration of inflammatory cells, including macrophages and lymphocytes, as demonstrated in the enlarged lower panel. Scale bar: 200 μm (upper panel) and 20 μm (lower panel). (E) Protein concentration in BALF. (F) Total cell and (G) macrophage and neutrophil counts in BALF. Lung sections stained with antibodies specific for (H) macrophages (Gal3) and (I) neutrophils (Neu). Quantification of positive cells of Gal3 (H) and Neu (I) in each experimental group. (J) mRNA levels of Tnf, Il1b, Il6, Il17a, and Ifng in lung tissues (n = 5–10 per group). Scale bar: 100 μm. ∗p < 0.05 compared with control. p < 0.05 compared with PM10.
Fig. 2
Fig. 2
PM promotes pulmonary fibrosis in mice. (A) Lung collagen fiber (Masson's trichrome staining) and collagen deposition (Sirius Red staining); yellow and black arrows: collagen deposition. Scale bar: 50 μm (upper panel) and 100 μm (lower panel). Quantification of collagen-fiber depositions. Severity evaluated on a scale from 0 to 3. (B) Measurement of fibronectin levels in lung tissues. (C) Col1a, Col3a, Mmp9, Mmp2, Tgfb1, and Acta2 mRNA levels in lung tissues. (D) Abundance of collagen I, collagen III, MMP9, MMP2, TGF-β, and α-SMA in lung tissues. Quantification of protein expression (n = 4–6 per group). ∗p < 0.05 compared with control. p < 0.05 compared with PM10.
Fig. 3
Fig. 3
PM exposure induces pulmonary oxidative stress and cell apoptosis. (A) Lung sections stained with an antibody specific for 8-hydroxy-2′-deoxyguanosine (8-OHDG). Quantification of 8-OHDG-positive cells. Scale bar: 100 μm. (B) Immunofluorescence for TUNEL (green) and DAPI (blue) staining. Scale bar: 50 μm. Bar graphs represent TUNEL (+)/DAPI (+) cells in the lung tissues. (C) Levels of reactive oxygen species (ROS) in the lung tissues. (D) Measurement of 4-HNE contents. (E) Superoxide dismutase (SOD) activity. (F) PARP, cleaved caspase-3, BAX, and Bcl-2 abundance in lung tissues. Quantification of protein expression (n = 4–9 per group). ∗p < 0.05 compared with control.
Fig. 4
Fig. 4
Frequency of immune cells in LN of mice. (A) Contour plots of TCRβ/B220 profiles and B and T cell proportions, respectively (left). Summary of B and T cell frequency (right). (B) Contour plots of CD4/CD8 profiles and CD4+ and CD8+ T cell proportions, respectively (left). Summary of CD4+ and CD8+ T cell proportions in mice (middle). CD4/CD8 ratio in mice (right). (C) Contour plots of CD44/CD49d profiles and proportions of CD44CD49dlow naïve and CD44+CD49dlow/hi memory T cells, respectively (top). Naïve- and memory-phenotype analysis of CD8+ T cells. Frequency of naïve and memory CD8+ T cells in mice (bottom). (D) Contour plots of CD44/CD49d profiles and CD44CD49dlow naïve, CD44+CD49dlow virtual memory and CD44+CD49dhi effector memory T cell proportions, respectively (top). Naïve- and memory-phenotype analysis of CD4+ T cells. The frequency of naïve and memory CD4+ T cells in mice (bottom). Contour plots of (E, left) TCRβ/CD1dtet, (F, left) TCRβ/γδTCR, and (G, left) TCRβ/NK1.1 profiles and NKT, γδ T, and NK cell proportions, respectively. Summary of (E, right) NKT, (F, right) γδ T, and (G, right) NK cell proportion. ∗p < 0.05, ∗∗p < 0.01, ∗∗∗p < 0.001, and NS mean not significant.
Fig. 5
Fig. 5
Effect of PM on CD8+ and CD4+ T cell responses. Lymphocytes isolated from mice were stimulated with PMA/Ionomycin and assessed for IFN-γ, TNF-α, and IL-4 expression in CD8+ (A) and CD4+ T cells (B). IFN-γ, TNF-α, and IL-4 profiles are representative of one independent experiment (n = 10) (left). Bar graph shows the proportion (%) of IFN-γ, TNF-α, and IL-4-producing CD8+ (A) and CD4+ T cells (B). Data represent the mean ± SEM. ∗p < 0.05, ∗∗p < 0.01, ∗∗∗p < 0.001, and NS, not significant. (C) Measurement of TNF-α, IL-1β, IL-6, IL-17, and IFN-γ in BALF (n = 8). (D) Measurement of IL-4, IL-5, and IL-13 in BALF (n = 8). (E) Plasma Ig concentrations in PM-exposed mice. Sera were collected from three groups (n = 7): control, PM10 exposure, and PM2.5 exposure. Each point represents an individual mouse. ∗p < 0.05 compared with control. p < 0.05 compared with PM10.
Fig. 6
Fig. 6
Effect of PM-induced NRF2 upregulation on TH1/TH2 differentiation. (A) Nfe2l2, Gclc, Nqo1, and Hmox1 mRNA levels in lung tissues (n = 3). (B) NRF2 and HO-1 abundance in lung tissues. β-actin was used as a loading control. Bar graphs represent the relative protein expression (n = 4). ∗p < 0.05 compared with control. (C) Nfe2l2 mRNA (top) and NRF2 protein (bottom) levels in T cells from WT, Nrf2−/−, and Nrf2Tg mice (n = 3). β-actin was used as the loading control. (D) Expression of Nfe2l2 mRNA and its target genes in mice (n = 5). (E) Naïve CD4+ T cells were cultured under TH differentiation conditions. IFN-γ, IL-4, and IL-17 levels were assessed using intracellular staining. Contour plots are representative of three independent experiments. ∗p < 0.05, ∗∗p < 0.01, ∗∗∗p < 0.001, and ND, nondetectable.
Fig. 7
Fig. 7
NRF2 deficiency alleviates cytokine responses and symptoms induced by PM2.5 exposure. (A) Schematic of PM-induced lung injury mouse model. Mice were anesthetized with isoflurane and treated with 20 μg/kg PM2.5 in 20 μL PBS daily via intranasal instillation for ten weeks; control mice were treated with PBS (n ≥ 4 per group) (B) Total cell (left) macrophage (middle), and neutrophil (right) counts in BALF (n ≥ 4/group). ∗p < 0.05, ∗∗p < 0.01, ∗∗∗p < 0.001, ∗∗∗∗p < 0.0001 and ND, nondetectable. (C) Lung and (D) BAL cells from mice were stimulated with PMA/Ionomycin and assessed for IFN-γ, and IL-4 expression in CD4+ T cells by intracellular staining. IFN-γ and IL-4 profiles are representative of one independent experiment (n ≥ 4 per group) (left); bar graph presents the proportion (%) of IFN-γ- and IL-4-producing CD4+ T cells (middle); line graph presents the ratio of IFN-γ and IL-4 in PM-induced mice (Ratio: PM2.5/control) (right). ∗p < 0.05, ∗∗p < 0.01, ∗∗∗p < 0.001, and NS, not significant. (E) IL-4, IL-5, and IL-13 in BALF of PM-induced Nrf2−/−, WT, and Nrf2Tg mice (n ≥ 4 per group). Data represent the mean ± SEM. ∗p < 0.05, ∗∗p < 0.01, ∗∗∗p < 0.001, and ND, nondetectable. (F) Representative images of H&E staining of the lung tissues. Red arrows: areas of PM particle penetration into lung tissues. Scale bar: 100 μm (upper panel) and 20 μm (lower panel).

Similar articles

References

    1. Carvalho H. New WHO global air quality guidelines: more pressure on nations to reduce air pollution levels. Lancet Planet. Health. 2021:e760–e761. doi: 10.1016/s2542-5196(21)00287-4. - DOI - PubMed
    1. Kim K.H., Kabir E., Kabir S. A review on the human health impact of airborne particulate matter. Environ. Int. 2015:136–143. doi: 10.1016/j.envint.2014.10.005. - DOI - PubMed
    1. WHO Guidelines Approved by the Guidelines Review Committee . World Health Organization© World Health Organization; Geneva: 2021. WHO Global Air Quality Guidelines: Particulate Matter (PM(25) and PM(10)), Ozone, Nitrogen Dioxide, Sulfur Dioxide and Carbon Monoxide. 2021. - PubMed
    1. Churg A., Xie C., Wang X., Vincent R., Wang R.D. Air pollution particles activate NF-kappaB on contact with airway epithelial cell surfaces. Toxicol. Appl. Pharmacol. 2005:37–45. doi: 10.1016/j.taap.2005.01.013. - DOI - PubMed
    1. Losacco C., Perillo A. Particulate matter air pollution and respiratory impact on humans and animals. Environ. Sci. Pollut. Res. Int. 2018:33901–33910. doi: 10.1007/s11356-018-3344-9. - DOI - PubMed

LinkOut - more resources