. 2025 Jul 14;43(7):1242-1260.e9.
doi: 10.1016/j.ccell.2025.03.025. Epub 2025 Apr 10.

Pan-cancer human brain metastases atlas at single-cell resolution

Affiliations

Pan-cancer human brain metastases atlas at single-cell resolution

Xudong Xing et al. Cancer Cell. .

Abstract

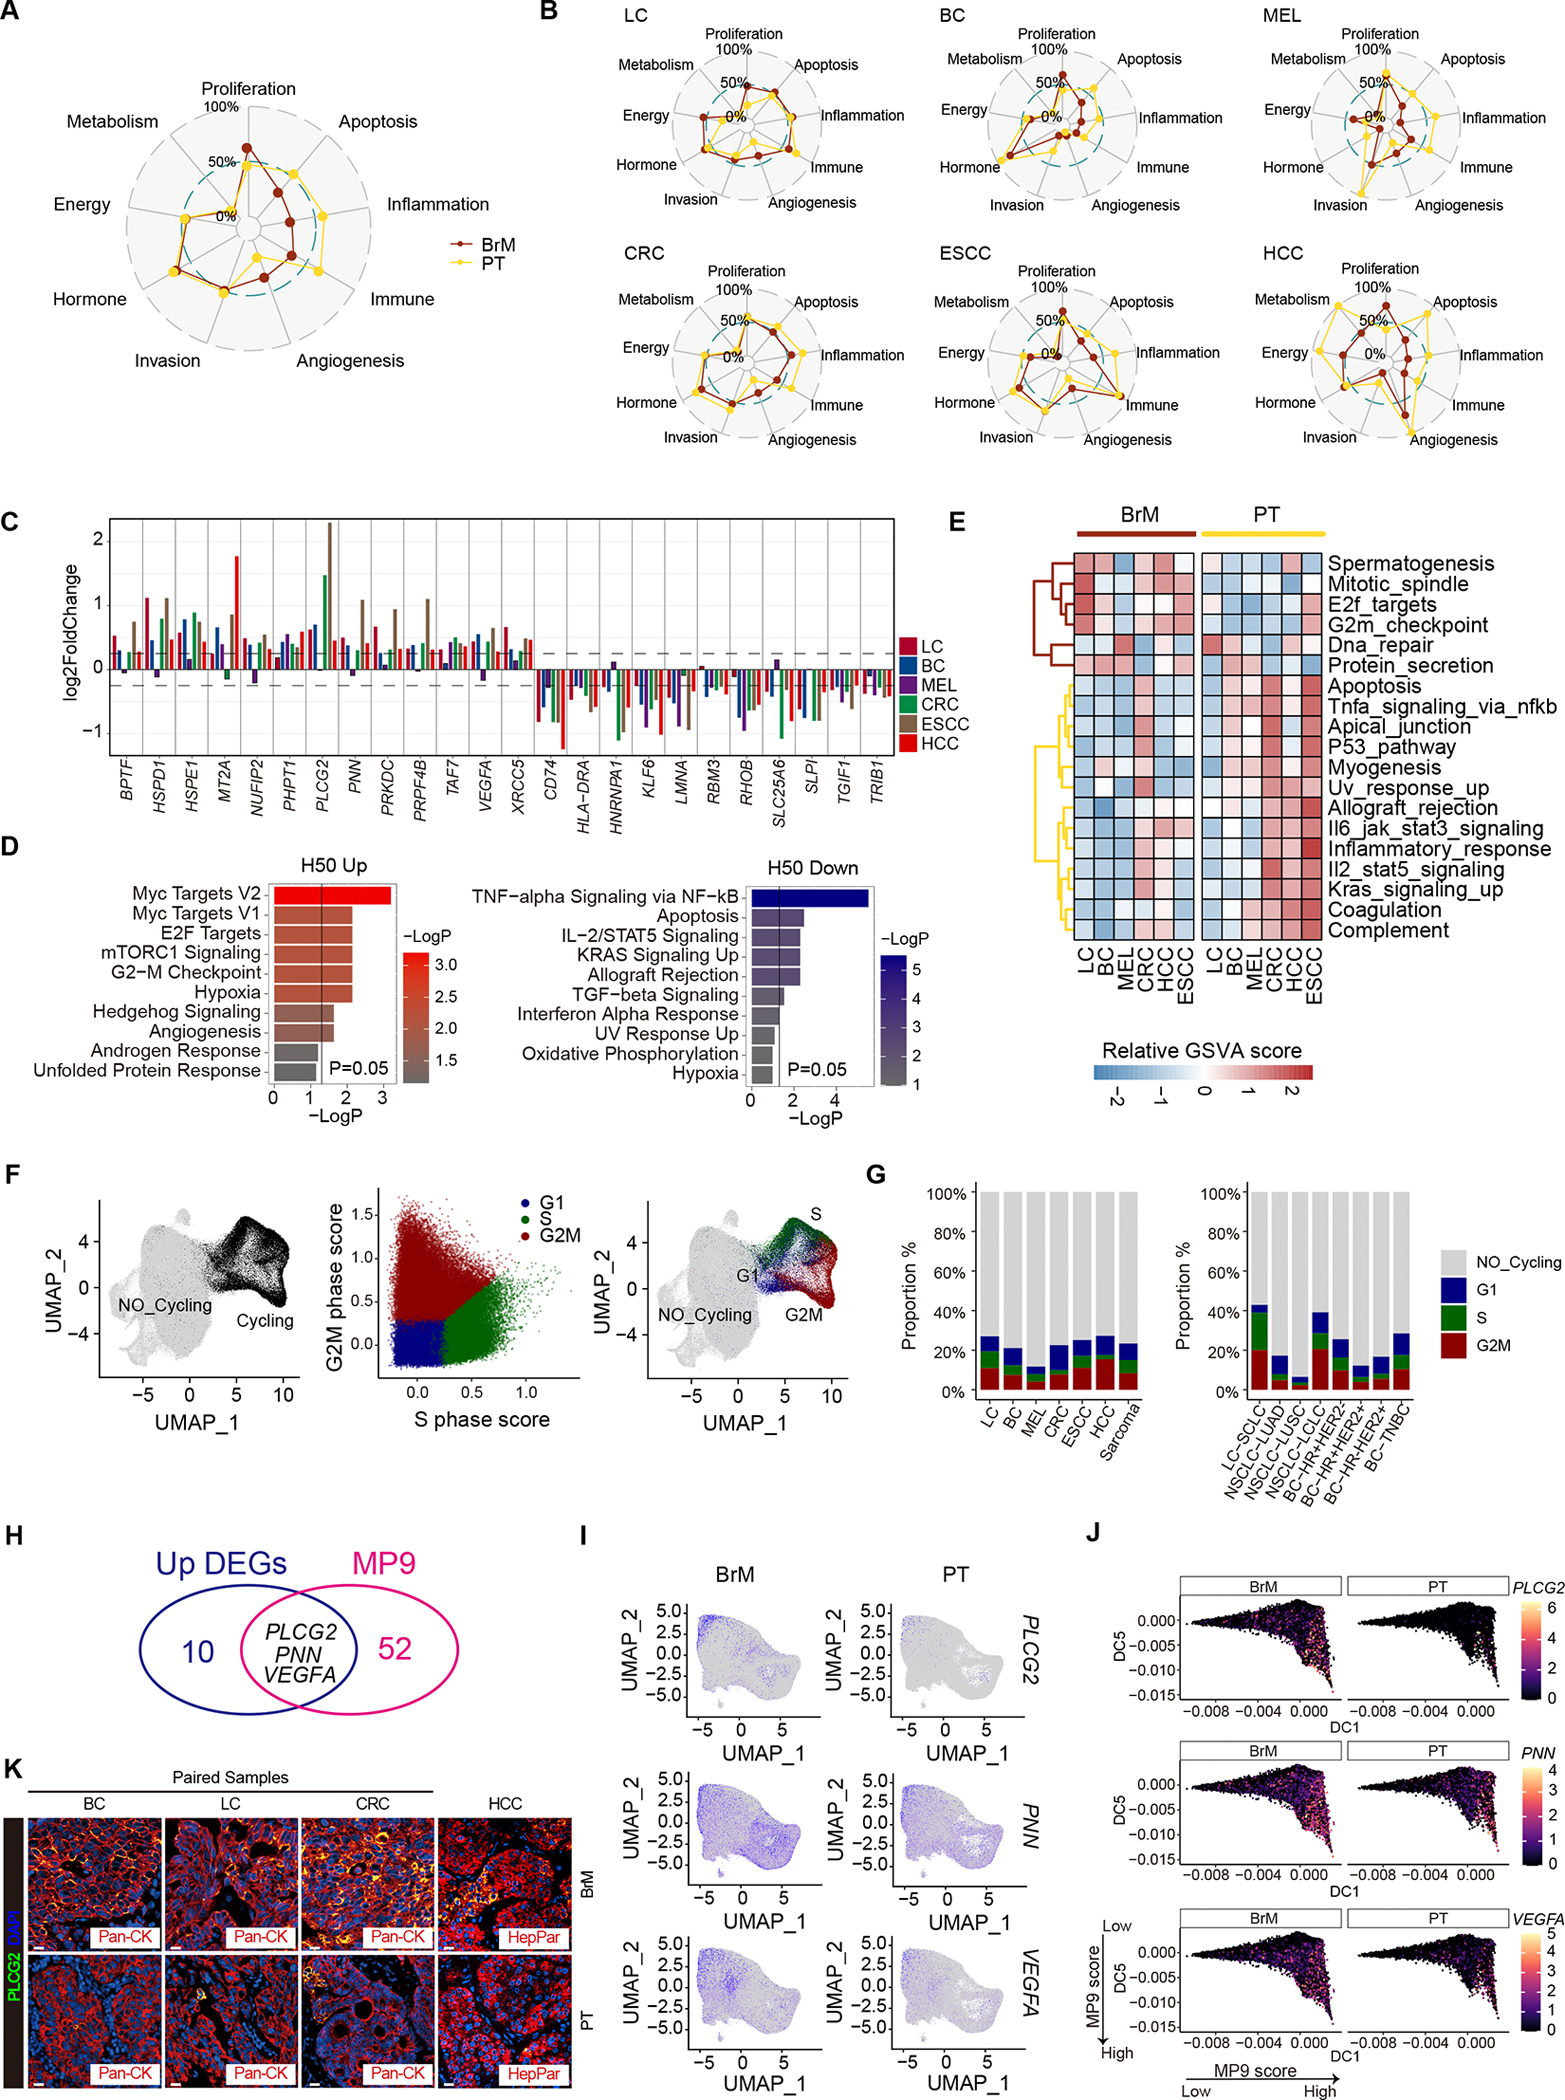
Brain metastases (BrMs) remain a major clinical and therapeutic challenge in patients with metastatic cancers. However, advances in our understanding of BrM have been hampered by the constrained sample size and resolution of BrM profiling studies. Here, we perform integrative single-cell RNA sequencing analysis on 108 BrM samples and 111 primary tumor (PTs) samples to investigate the characteristics and remodeling of cell states and composition across cancer lineages and subsets. Recurring and enriched features of malignant cells are increased chromosomal instability, marked proliferative and angiogenic hallmarks, and adoption of a neural-like BrM-associated metaprogram. Immunosuppressive myeloid and stromal subsets dominate the BrM tumor microenvironment, which are associated with poor prognosis and resistance to immunotherapy. Furthermore, five distinct BrM ecotypes are identified, correlating with specific histopathological patterns and clinical characteristics. This work defines hallmarks of BrM biology across cancer types and suggests that shared dependencies may exist, which may be exploited clinically.

Keywords: brain metastases; central nervous system; chromosomal instability; ecotype; hallmarks of cancer; metastatic tumor cell; neuronal-like cell state; pan-cancer; single-cell RNA sequencing; tumor microenvironment.


Conflict of interest statement

Declaration of interests B.I. has received consulting fees/honoraria from Volastra Therapeutics Inc., Merck, AstraZeneca, Novartis, Eisai, and Janssen Pharmaceuticals and has received research funding to Columbia University from Alkermes, Arcus Biosciences, Checkmate Pharmaceuticals, Compugen, Immunocore, Merck, Regeneron, and Synthekine.

Figures

Figure 1.
Figure 1.. Study design and cellular landscape of pan-cancer brain metastasis
(A) Schematic depicting the study design, created with BioRender.com. (B) The distribution of cancer types and cancer subtypes involved in the pan-cancer BrM cohort. (C) UMAP visualizations of major cell lineages. (D) The expression level and percentage of cell-type specific markers. (E and F) Bar plots comparing cell-type fractions across cancer types (E) and cancer subtypes (F). Data are represented as the mean ± SEM. *p < 0.05, **p < 0.01, ***p < 0.001, ****p < 1e-04; Two-tailed unpaired Wilcoxon rank-sum test. (G) Ternary plots showing the remodeling of the ecological composition between metastatic and primary tumor sites. The proportions were scaled to range from 10% to 90% for visualization. See also Figure S1, Table S1 and Table S2.
Figure 2.
Figure 2.. Characterization of chromosomal instability and identification of meta-programs of malignant cells
(A) Fraction of genome altered in BrM and PTs across different cancer types. Two-tailed unpaired Wilcoxon rank-sum test. (B) Scoring of CIN70 signature on BrM and PTs across different cancer types. Two-tailed unpaired Wilcoxon rank-sum test. (C) Top: Jaccard similarity indices for comparisons among robust NMF programs based on their top 50 genes. Bottom: NMF scores for all MP genes (rows) across all robust NMF programs (columns). Representative genes are labelled. (D) Heatmap showing the Jaccard similarity indices for comparisons between the MPs from Gavish et al. (2023) (rows) and the MPs identified from this study (columns). (E) UMAP indicating different MPs assignment. (F) UMAP projection of identified malignant cells colored by the program signature score of MP9. (G) UMAP indicating different MPs assignment in BrM and PTs, respectively. (H) Differential abundance of MP clusters between BrM and PTs. See also Figure S2 and Table S4.
Figure 3.
Figure 3.. Remodeling of transcriptomic hallmarks in malignant cells from PTs to BrM
(A and B) Radar plots showing the relative expression of nine transcriptomic hallmarks for malignant cells between BrM and PTs (A) across different cancer types (B). (C) The expression trends of the consistently upregulated/downregulated DEGs. Each bar color indicates a different cancer type, and the bars without a black border indicate significant differences. (D) The functional enrichment of consistently upregulated (left) and downregulated (right) DEGs in H50. (E) Heatmap showing differences in the selected H50 gene set scored per cell by GSVA between BrM and PTs across different cancer types. (F) UMAP of integrated malignant cell transcriptomes indicating cycling state. (G) Bar plot showing the fractions of various cycling states across different cancer type (left) and cancer subtypes (right). (H) Venn diagram showing three overlapped genes between MP9 program genes and consistently upregulated genes in BrM compared to PTs. (I) UMAP plots of expression levels of three genes split by different groups. (J) Diffusion component (D.C.) analysis of malignant cells colored by PLCG2 expression (first row), PNN expression (second row), and VEGFA expression (third row) in BrM and PTs. Increase in DC1 and decrease in DC5 components correspond to higher MP9 scores. (K) Representative IF images showing the expression of PLCG2 in the tumor cells of BrM or PT samples. BC, LC, and CRC samples were paired. The following canonical tumor markers were used for staining tumor cells: Pan-CK for BC, LC, and CRC. HepPar for HCC. Scale bar, 20 μm. See also Figure S3 and Table S5.
Figure 4.
Figure 4.. Landscape and differences of vascular cells in BrM/PTs profiled by scRNA-seq
(A) UMAP view of endothelial clusters. (B) Heatmap of marker gene expression in endothelial clusters. (C) Density plot depicting the distribution of each endothelial cluster between BrM and PTs. (D) Average proportion of each endothelial subtype between BrM and PTs. (E) Differential abundance of endothelial cell clusters between BrM and PTs. (F) UMAP plots of expression levels of four representative genes. (G) UMAP plots of expression levels of FLT4 and LYVE1 split by different groups. (H) The expression of different functional genes in the E03 clusters (BrM vs. PTs). Two-tailed unpaired Wilcoxon rank-sum test. (I) Representative images showing the lymphatic endothelial-like cells (CD31+FLT4+) and the expression of CD276 and CD55 in these cells in the TME of BC, LC, HCC, and CRC BrM samples. Scale bar, 10 μm. (J) GSEA enrichment plot for three cancer treatment response signatures. (K) UMAP view of fibroblast and mural cell clusters. (L) Heatmap of marker gene expression in different clusters of (K). (M) Same as (E), but for fibroblast and mural cell clusters. (N) Representative multiplexed IF staining of endothelial cells (CD31+) and pericytes (CD146+) and the expression of MMP9 and PGF in pericytes from normal brain, BrM and PT samples. BC and LC samples were paired. Scale bar, 10 μm. See also Figure S4.
Figure 5.
Figure 5.. The lymphoid landscape and transcriptional states in BrM/PTs profiled by scRNA-seq
(A) UMAP view of T and NK cell clusters. (B) Heatmap of marker gene expression in T and NK cell clusters. (C) Average proportion of each T and NK cell subtype in BrM and PTs. (D) Differential abundance of lymphoid subsets between BrM and PTs. (E) Bar plots comparing cell-type fractions across cancer types. Data are represented as the mean ± SEM. *p < 0.05, **p < 0.01, ***p < 0.001, ****p < 1e-04; Two-tailed unpaired Wilcoxon rank-sum test. (F) Representative images of IF staining of exhausted T cells (LAG3+CD8+ and CTLA4+CD4+) in the brain metastatic TME. Scale bar, 10μm. (G) Upper panels: the distribution of naïve (left), effector (middle), and exhaustion (right) state scores in each T/NK cell subtype. Lower panels: UMAP plots with projection of different T/NK cell state scores. (H) Ridgeline plot (left) and cumulative distribution function (middle) showing the distribution of effector (upper), and exhaustion (lower) state scores between BrM and PTs, as well as for each T/NK subtype (right). Two-tailed unpaired Wilcoxon rank-sum test. (I) Transformation Index score of effector (left) and exhaustion (right) states between BrM and PTs across different cancer types. Two-tailed unpaired Wilcoxon rank-sum test. Red asterisks denote significant differences. (J and K) The expression of effector scores (J) and exhaustion scores (K), as well as selected markers (right), across different cancer types in BrM. (L) The expression of effector scores (upper panel) and exhaustion scores (low panel) between EGFR wild-type and EGFR mutant samples in BrM. Two-tailed unpaired Wilcoxon rank-sum test. See also Figure S5.
Figure 6.
Figure 6.. Detailed characterization of myeloid cells in BrM/PTs profiled by scRNA-seq
(A) UMAP view of myeloid cell clusters. (B) Heatmap of marker gene expression in myeloid cell clusters. (C) Differential abundance of myeloid subsets between BrM and PTs. (D) Boxplot comparisons of cell-type fractions of M04, contrasting BrM and PT samples across various cancer types. Two-tailed paired Wilcoxon signed-rank test. (E) Representative IF images of hypoxic macrophages (ADM+Galectin-3+) in the TME of BrM and PT samples. Scale bar, 20μm. (F) UMAP plots with projection of four different myeloid cell state scores. (G) The expression levels of four myeloid cell state scores across various myeloid clusters. (H) Ridgeline plot showing the distribution of four myeloid cell state scores between BrM and PTs. (I) Cumulative distribution function (left) showing the distribution of M1 and M2 state scores between BrM and PTs, as well as for each myeloid subtype (right). Two-tailed unpaired Wilcoxon rank-sum test. (J) Representative IF images of infiltrating M2-type myeloid cells (CD163+IBA1+ and ARG1+IBA1+) in the TME of BrM and PTs. BC, LC, and CRC samples were paired. Scale bar, 20 μm. (K) Transformation Index scores of M1 (upper) and M2 (lower) states between BrM and PTs across different cancer types. Two-tailed unpaired Wilcoxon rank-sum test. Red asterisks denote significant differences. (L) The expression of M1 and M2 cell state scores across different cancer types in BrM. (M and N) Similar to (L), but for representative M2 markers (M) and selected immune checkpoints or regulators (N). (O) The expression of M1 scores (left) and M2 scores (right) between EGFR wildtype and EGFR mutant samples in BrM. Two-tailed unpaired Wilcoxon rank-sum test. See also Figure S6.
Figure 7.
Figure 7.. Intercellular interactions and ecotypes of TME cells in BrM
(A) Bubble plot illustrating the interactions of selected coinhibitory or checkpoint ligand-receptor pairs. Significant interactions (p < 0.05) are presented as a ring. (B) Representative PLA signals between Nectin2 and TIGIT in BrM samples. Confocal microscopy images of ECs (CD31+, red), fibroblast (α-SMA+, red) and T cell (CD3+, green) reveal PLA signal (interaction signal, yellow) between Nectin2 and TIGIT. Scale bar, 15 um. (C) Heatmap showing the five ecotypes of BrM inferred based on TME cell compositions. Barplot showing the distribution of various cell lineages in each sample. (D) UMAP plots showing the major cell lineages of representative samples from each ecotype group. (E) Representative multiplexed IF images showing five different ecotypes in BrM. The following tumor markers were used: Vimentin (breast carcinosarcoma) for Balance, Pan-CK (pulmonary papillary adenoma) for Lymphoid, Pan-CK (breast invasive ductal carcinoma) for Myeloid, Pan-CK (small cell lung cancer) for Desert and Pan-CK (breast invasive ductal carcinoma) for Stromal. Scale bar, 20 μm. (F-H) Pie chart showing the composition of each ecotype across different cancer types (F), cancer subtypes (G), and EGFR-type groups (H). (I-K) Barplot showing the composition of each ecotype across different clinical groups, including gender (I), age (J), and treatment (K). See also Figure S7 and Table S6.

References

    1. Achrol AS, Rennert RC, Anders C, Soffietti R, Ahluwalia MS, Nayak L, Peters S, Arvold ND, Harsh GR, Steeg PS, and Chang SD (2019). Brain metastases. Nat Rev Dis Primers 5, 5. 10.1038/s41572-018-0055-y. - DOI - PubMed
    1. Suh JH, Kotecha R, Chao ST, Ahluwalia MS, Sahgal A, and Chang EL (2020). Current approaches to the management of brain metastases. Nat Rev Clin Oncol 17, 279–299. 10.1038/s41571-019-0320-3. - DOI - PubMed
    1. Boire A, Brastianos PK, Garzia L, and Valiente M (2020). Brain metastasis. Nat Rev Cancer 20, 4–11. 10.1038/s41568-019-0220-y. - DOI - PubMed
    1. Li W, Wang T, Zhu Y, Yu H, Ma L, Ding Y, Hong G, and Lei D (2022). Brain metastasis from colorectal cancer: Treatment, survival, and prognosis. Medicine (Baltimore) 101, e30273. 10.1097/MD.0000000000030273. - DOI - PMC - PubMed
    1. Aizer AA, Lamba N, Ahluwalia MS, Aldape K, Boire A, Brastianos PK, Brown PD, Camidge DR, Chiang VL, Davies MA, et al. (2022). Brain metastases: A Society for Neuro-Oncology (SNO) consensus review on current management and future directions. Neuro Oncol 24, 1613–1646. 10.1093/neuonc/noac118. - DOI - PMC - PubMed

LinkOut - more resources