. 2025 Apr 11;8(6):e202403078.
doi: 10.26508/lsa.202403078. Print 2025 Jun.

Optogenetic control of pheromone gradients and mating behavior in budding yeast

Affiliations

Optogenetic control of pheromone gradients and mating behavior in budding yeast

Alvaro Banderas et al. Life Sci Alliance. .

Abstract

During mating in budding yeast, cells use pheromones to locate each other and fuse. This model system has shaped our current understanding of signal transduction and cell polarization in response to extracellular signals. The cell populations producing extracellular signal landscapes themselves are, however, less well understood, yet crucial for functionally testing quantitative models of cell polarization and for controlling cell behavior through bioengineering approaches. Here we engineered optogenetic control of pheromone landscapes in mating populations of budding yeast, hijacking the mating-pheromone pathway to achieve spatial control of growth, cell morphology, cell-cell fusion, and distance-dependent gene expression in response to light. Using our tool, we were able to spatially control and shape pheromone gradients, allowing the use of a biophysical model to infer the properties of large-scale gradients generated by mating populations in a single, quantitative experimental setup, predicting that the shape of such gradients depends quantitatively on population parameters. Spatial optogenetic control of diffusible signals and their degradation provides a controllable signaling environment for engineering artificial communication and cell-fate systems in gel-embedded cell populations without the need for physical manipulation.


Conflict of interest statement

The authors declare that they have no conflict of interest.

Figures

Figure 1.
Figure 1.. Using optogenetics to interrogate the properties of cell-generated signaling gradients.
(A) Two types of chemotropism have been described in the literature (see text), short range (top) with no cell elongation involved and frequently observed in mating reactions (black dot represents the polarisome and pheromones—pink halo—are secreted locally), and long-range (displaying cell elongation), seen in artificial pheromone gradients. (B) The mating switch. Yeast cells switch from budding to mating morphologies when α-factor is present (top). This dose response is sharp and occurs in the nM range, close to the receptor Kd across strains. (C) When cells with opposite mating types are located at a distance, the generated α-factor gradient (red arrow, indicating the direction of decay) has a strength (amplitude and steepness) that defines where the concentration is sufficient for switching-on mating behavior. The profile of the α-factor pheromone not only depends on the local density of emitters contributing to the gradient but also on the presence of the extracellular α-factor peptidase Bar1 and, therefore, on the density of MATa cells. When Bar1 is absent or low, the position of the mating switch is expected to happen at a distance. In contrast, if Bar1 is high, the mating switch is displaced towards the source vicinity. (D) Because of low Bar1-mediated degradation of α-factor when MATa populations have low density, the α-factor gradients are expected to overlap and provide sufficient intensities to trigger mating behavior at a distance, but at the cost of reduced precision because of “confusing” local maxima. (E) Optogenetic control of α-factor and Bar1 emission allows spatial control of these two opposing activities. In the example shown, a Petri dish containing mating mixes is illuminated in specific regions, allowing us to stimulate production or degradation of the pheromone (red color), depending on which genetic determinant is controlled.
Figure 2.
Figure 2.. Optogenetic control of extracellular α-factor production allows tight spatial control of mating.
(A) The light-responsive α-factor-producing “opto-α” strain was engineered by replacing the native promoters of the two pheromone-coding genes in MATα (MFα1 and MFα2) with the PC120 promoter, which is responsive to the light-activated LOV domain EL222 transcription factor, and by later duplicating the MFα1 (which produces the highest amount of pheromone of the two genes) light-responsive locus. (B) The activity of the PFUS1 pheromone-responsive promoter in MATa receivers in stirred mating reactions as a function of light intensity. In the assay, the opto-α strain is co-incubated either with bar1Δ (top left) or a WT MATa (bottom left) PFUS1-GFP reporter strain. After 2 h, the mixes are assessed by flow cytometry. As a control, the reporters are incubated with WT MATα, and the baseline-subtracted relative response is calculated (right). Error bars are the SD of n = 3 biological replicates. (C) Agarose-embedded MATa-bar1Δ reporter strains (cells carrying cytoplasmic GFP) co-incubated with opto-α cells (carrying a red nuclear signal expressed by a mApple fluorescent protein) for 5 h under non-illuminated (left) and maximally illuminated (5.8 mW/cm2, right) conditions. (D, E) Quantification of mating efficiency through light-controlled pheromone production. (D, E) Light induces cell-cell fusion in the optogenetic mating assay measured as the appearance of diploid colonies only in illuminated regions (D), which was quantified at different light doses (E). (C) Efficiency is defined as relative to the activity of the WT MATα strain (C). Error bars are the SD of n = 3 biological replicates.
Figure S1.
Figure S1.. Comparison of pheromone levels produced by engineered strains with native gene dosage.
(A) Engineered “native” MATα (top) and MATa (bottom) sender strains harbor the native pheromone-producing genes with their promoters replaced with optogenetic (PC120) ones. (B, C) Schematic showing the corresponding mixes used in co-incubation assays used to quantify pheromone-mediated induction of partners (orange and blue lines correspond to traces in panel (C)). (C) Gene-expression responses of reporter strains in co-incubation assays measured in flow cytometry. Responses are normalized to the respective WT sender. (B) The orange and blue curves correspond to the sender strains with native gene dosage (top and bottom in panel (B), respectively). For comparison, the green curves corresponding to the enhanced opto-α strain with a WT (circles) or Bar1Δ (triangles) MATa reporter (Fig 2 in the main text) are shown. Notice that X-axis is logarithmic. For the orange trace, only the highest light-intensity sample was replicated. Error bars are the SD of three biological replicates.
Figure S2.
Figure S2.. Characterization of optogenetic induction.
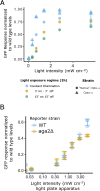
(A) Varying light exposure duty cycle in a strain without an extra-copy of MFα1 does not improve pheromone production. Co-incubation assays with different light exposure regimes. Varying duty cycles (the fraction of one period in which light is active) used on the opto-α strain with native gene dosage (“Native” opto-α) compared with the strain with extra gene dosage (opto-α), increasing the duration that cell cultures spent in the dark within a cycle, from zero to as little as 3 min reduced the overall response magnitude. (B) Sexual agglutination does not affect light exposure. Flow cytometry results showing the PFUS1-GFP response of a WT MATa reporter response compared with a strain which does not form sexual aggregates (yAA128 (1)). The sexual aggregation negative strain lacks the Aga2 subunit of the a-specific sexual agglutinin complex. Disaggregation before measurement was performed by strong “up and down” pipetting, followed by a sonication pulse.
Figure S3.
Figure S3.. Equivalent optogenetic mating assays used to quantify light-dependent mating efficiency.
Schematic for the “velvet” (left) and “direct” (right) variants of the assay used to quantify light-dependent mating efficiency. Regions of low or high light (bottom, blue) produce different diploid numbers. CSM: Complete supplement mixture. DMD: digital micromirror device. Lys: lysine. Met: Methionine (see the Materials and Methods section).
Figure 3.
Figure 3.. Optogenetic control of extracellular signal degradation allows tight spatial control of growth arrest.
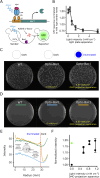
(A) Promoter replacement in the opto-Bar1 strain. EL222-mediated light-dependent expression of the native loci encoding Bar1 in the MATa strain (top) and the pheromone activity assay, in which exogenously added pheromone stimulates the sensitized GFP reporter strain (bottom). (B) Resulting light-dose response from the assay, measured by flow cytometry. The biological activity of the pheromone is defined relative to the activity of the WT MATa strain. Error bars are the SD of three biological replicas. (C, D) Diploid selective (C) and non-selective plates (D) showing mating efficiency and growth, respectively, in illuminated and dark regions. (D, E) Quantification of avoidance of cell cycle arrest (“intensity” corresponds pixel grey value which is proportional to yeast growth) in the opto-Bar1 strain as a function of the distance from the center (a radius), based on the integrated pixel intensity of a radial profile (traces shown correspond to the colored bars in (D), see the Materials and Methods section). (D, F) Light-dose dependency of cell cycle arrest in Petri-dish assays performed as in (D). In this case, growth is normalized to the value of non-activated opto-Bar1 cells (lowest growth). The growth of the WT is shown as a green dot. Error bars are the SD of two biological replicates.
Figure S4.
Figure S4.. Effect of optogenetically produced Bar1 on mating.
(A) Images of plates with mating assays using an opto-Bar1/MATα mix Illuminated at different intensities. The leftmost image is also shown in Fig 3C (where it is the plate in the right). Images with these plates and, in addition, the “dark” and “WT” controls in Fig 3C were segmented to identify diploids and then counted. (B) Quantification of diploid colony density across different illumination intensities for Illuminated and dark areas in plates (see Fig 3) with mixes of MATα strain with opto-Bar1 (left). A MATa/MATα WT mix is shown for comparison (right).
Figure 4.
Figure 4.. Optogenetic generation of pheromone gradients through the half-domain assay.
(A) Half-domain assay. Agarose-embedded cells are located at the bottom of the mini well and half of the glass surface is illuminated to induce EL222-dependent expression. (B) To determine the position of the light border in samples along the acquisition path (red arrows), a control strain that activates EL222-dependent fluorescent protein expression is run in parallel in adjacent wells. The mean values of the border positions above and below the sample correspond to the position of the light border in the sample. (C) Schematic representation of the experiment, close to the light-dark transition border. (D) Microscopy image showing an overview of the mating reaction with the controls for the border location (top and bottom row) displaying strong YFP fluorescence on each side of the mating reaction (center row). Arrowheads at the bottom show where the image was stitched together. In the sample mating reaction (center), opto-α has a red nuclear marker, whereas reporter MATa-bar1Δ expresses GFP when stimulated by pheromones. Samples were imaged after 5 h of light exposure. (E) Example fields along the experimental length showing the increased abundance of elongated phenotypes and the increase in GFP levels in the illuminated region.
Figure S5.
Figure S5.. Cell identity and overall appearance of the sampled stripe in the half-domain assay.
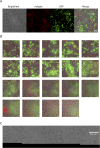
(A) Imaging resolution and cell identity in the half-domain assay. A mixture of the opto-α strain (mApple, red channel) pheromone sender and the MATa-bar1Δ α-factor receiver (GFP, green channel) in an illuminated region of the half-domain experiment showing a single tile in the stitched analyzed image. (B) Detail of a ROI within each tile in the complete analyzed region shown from illuminated (leftmost) position to the dark (rightmost) position (read row by row from left to right.). (C) Stitching quality. The lower end of three stitched images centered at the central image. Stitches are evidenced by the y-position realignment correction performed for each image. The correction is needed because of the tilt of the 24-well plate with respect to the microscope stage frame. Scale bar: 500 μm.
Figure 5.
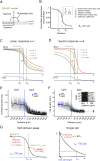
Figure 5.. Quantitative properties of optogenetically generated gradients recapitulate switch-like and linear responses in MATa cells.
(A) Schematic representation of the model used to infer α-factor gradient shape. The area on top of the cells is explicitly included and the region where pheromone uptake occurs is restricted to the bottom. (B) Concentration profile of α-factor at steady state (Equation (2), see the Supplemental Data 1). (C, D) Normalized response of the receptor (Equation (3) normalized by its theoretical maximal value Cn/(1+Cn)) for half-domain expression of α-factor, showing predictions for the shapes of responses using a Hill coefficient equal to n = 1 (panel (C)) and n = 4 (panel (D)). Hill coefficients greater than one correspond to a shift in the response towards a higher concentration of α-factor and a steeper response. (E) Quantification of single-cell gene-expression output (data: black, means: blue) and overlayed model fit (green), with the Hill coefficient set to 1, full set of parameters in Table S3. (F) Quantification of single-cell gene morphological response (data: black, means: blue) and similarly overlayed model fit (green), with a fitted Hill coefficient of 3, full set of parameters in Table S3. The inset shows the absence of gradient alignment of MATa-bar1Δ. The orientation angle of single cells (points) with large area (a proxy for elongation in the light-domain) respect to the perpendicular to the light-dark transition border. An angle of 0° represents a cell with the long axis of its fitted ellipse oriented perpendicular to the light-dark transition border, whereas at an angle of 90° the same axis is totally parallel. The cutoff for filtering out small cells was 200 pixels. (G) Population-level and single-cell estimations of pheromone-profile parameters, based on the 2D + 1 model.
Figure S6.
Figure S6.. Machine learning–based data analysis.
(A) Examples of segmentations showing bright field images with their predicted masks superimposed on each one of two machine-learning models (see the Materials and Methods section). (B) Segmentation was performed on three mixes. The MATa-bar1Δ receiver was incubated with WT MATα (red), the WT MATa receiver was incubated with the opto-α strain (blue) and the MATa-bar1Δ receiver was incubated with the opto-α strain (green). Distance-dependency of the single-cell area of receivers as a function of distance from the measurement origin (yellow lines show the light border position of the MATa-bar1Δ/opto-α mix). (C, D, E) Corresponding single-cell fluorescence data before normalization (C), after background subtraction (D) and after baseline (blue trace in panel (C)) subtraction and normalization to WT (red trace in panel (C)) levels (E).
Figure S7.
Figure S7.. Comparison between the morphological and gene-expression responses in the half-domain experiment.
Observed gene expression from the FUS1 promoter (GFP fluorescence) and phenotypic (cell length) responses were baseline-subtracted and renormalized, using the θ(x)=(θˆ(x)b)/A formula and fitted values for A and b (Table S3), to obtain responses in comparable units. Points represent the mean value of each one of the 53 bins; vertical lines are standard errors. Solid lines are model fits; model parameters (see the main text) are shown.
Figure 6.
Figure 6.. Bar1-generated α-factor gradients reveal restricted Bar1 diffusion.
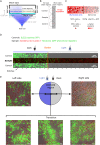
(A) Schematic representation of the half-domain assay for opto-Bar1, close to the light-dark transition border. Emitter cells produce α-factor homogeneously. Light-induced Bar1 secretion occurs with unknown spatial distributions (bottom box). (B) Zoomed-out depiction of the half-domain assay for Bar1 production and microscopy imaging of Bar1 emitters (cells with red nuclei), receivers (cells with green nuclei), and newly formed diploids (cells with yellow nuclei). The yellow line represents the position of the left limit of the light-dark transition border. (C) Quantification of the single-cell morphological response (cell length) of opto-Bar1. The light border is represented by the blue vertical line corresponding to the border location determined with controls run in parallel (see the Materials and Methods section). The blue dots correspond to the mean value in each one of 30 bins and the error bar represents its standard error. The purple line represents the zero parameter fit of the perfect sink model (see text).
Figure S8.
Figure S8.. Border precision in the opto-bar1 gradient generation experiment (Fig 6 in the main text).
(A) Stitched files for the upper and lower “biomask” light imprint controls (as given in Fig 4 in the main text). (B) Mean area intensity profile along the X-axis (correspond to the yellow vertical lines in Fig 6 in the main text)
Figure S9.
Figure S9.. Cell proliferation in the half-domain assay.
Cell counts for senders of α-factor (WT MATα), receivers of α-factor (opto-Bar1) and diploid (fusion events) in the opto-Bar1 half-domain assay (Fig 6). The bin width is 250 μm; the first and last bins were removed because they contained only trace counts.

References

    1. Simsek MF, Özbudak EM (2022) Patterning principles of morphogen gradients. Open Biol 12: 220224. 10.1098/rsob.220224 - DOI - PMC - PubMed
    1. Stapornwongkul KS, Vincent J-P (2021) Generation of extracellular morphogen gradients: The case for diffusion. Nat Rev Genet 22: 393–411. 10.1038/s41576-021-00342-y - DOI - PubMed
    1. Clark-Cotton MR, Jacobs KC, Lew DJ (2022) Chemotropism and cell-cell fusion in fungi. Microbiol Mol Biol Rev 86: e0016521. 10.1128/mmbr.00165-21 - DOI - PMC - PubMed
    1. Hanson SJ, Wolfe KH (2017) An evolutionary perspective on yeast mating-type switching. Genetics 206: 9–32. 10.1534/genetics.117.202036 - DOI - PMC - PubMed
    1. Murphy HA, Zeyl CW (2010) Yeast sex: Surprisingly high rates of outcrossing between asci. PLoS One 5: e10461. 10.1371/journal.pone.0010461 - DOI - PMC - PubMed

MeSH terms

Substances

LinkOut - more resources