. 2025 Apr 11;16(1):3451.
doi: 10.1038/s41467-025-58364-7.

An innovative approach using CRISPR-ribonucleoprotein packaged in virus-like particles to generate genetically engineered mouse models

Affiliations

An innovative approach using CRISPR-ribonucleoprotein packaged in virus-like particles to generate genetically engineered mouse models

Tae Yeong Jeong et al. Nat Commun. .

Abstract

Genetically engineered mouse models (GEMMs) are crucial for investigating disease mechanisms, developing therapeutic strategies, and advancing fundamental biological research. While CRISPR gene editing has greatly facilitated the creation of these models, existing techniques still present technical challenges and efficiency limitations. Here, we establish a CRISPR-VLP-induced targeted mutagenesis (CRISPR-VIM) strategy, enabling precise genome editing by co-culturing zygotes with virus-like particle (VLP)-delivered gene editing ribonucleoproteins (RNPs) without requiring physical manipulation or causing cellular damage. We generate Plin1- and Tyr-knockout mice through VLP-based SpCas9 or adenine base editor (ABE)/sgRNA RNPs and characterize their phenotype and germline transmission. Additionally, we demonstrate cytosine base editor (CBE)/sgRNA-based C-to-T substitution or SpCas9/sgRNA-based knock-in using VLPs. This method further simplifies and accelerates GEMM generation without specialized techniques or equipment. Consequently, the CRISPR-VIM method can facilitate mouse modeling and be applied in various research fields.


Conflict of interest statement

Competing interests: T.Y.J., D.E.Y., J.K.S., and K.K. have filed a patent application with the Korea Patent Office (Application No. 10-2024-0046182) related to the generation of genetically engineered animals using the CRISPR-VLP system and its applications described in this study. The other authors have no competing interests to declare.

Figures

Fig. 1
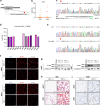
Fig. 1. Gene editing using the CRISPR-VIM method with CRISPR-RNP packaged in VLPs in mouse Neuro-2a cells and mouse zygotes.
a Scheme of gene editing using the CRISPR-VIM method in cells. Created in BioRender. Kim, K. (2025) https://BioRender.com/d01i280. b Generated indel frequencies at 11 mouse gene targets using SpCas9/sgRNA packaged in VLPs in Neuro-2a cells. c A-to-G conversion efficiencies for 9 targets obtained using ABE8e/sgRNA packaged in VLPs in Neuro-2a cells. Numbers in panels b and c represent mean values (n = 4). d Scheme of targeted mutagenesis of mouse zygotes via the CRISPR-VIM method. Created in BioRender. Kim, K. (2025) https://BioRender.com/e39e668. e, f Comparison of gene editing efficiencies based on treatment time (0, 1, 5, 10, and 20 h) in mouse zygotes at Tyr (e) or Plin1 (f) target site using ABE8e/sgRNA packaged in VLPs (Tyr: 10%, 1.97 × 109 VLPs; 20%, 3.94 × 109 VLPs; Plin1: 10%, 8.92 × 108 VLPs; 20%, 1.78 × 109 VLPs). gi Gene editing efficiencies at Plin1 (g), Dnmt1 (h), and Gata3 (i) targets were compared based on treatment rates (10% or 20% v/v VLPs) using ABE8e/sgRNA packaged in VLPs (Plin1: 10%, 8.92 × 108 VLPs; 20%, 1.78 × 109 VLPs; Dnmt1: 10%, 1.52 × 109 VLPs; 20%, 3.04 × 109 VLPs; Gata3: 10%, 1.53 × 109 VLPs; 20%, 3.07 × 109 VLPs). j Embryonic development rates at different treatment doses using ABE8e/sgRNA packaged in VLPs. The numbers above the bars indicate the counts of morula and blastocysts formed from all two-cell stage embryos. All data are shown as the mean ± SD. Source data are provided as a Source Data file.
Fig. 2
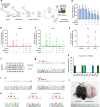
Fig. 2. Generation and phenotypic analysis of a Perilipin1-deficient mutant mouse model using Cas9/sgRNA packaged in VLPs.
a The target sequence at the Perilipin1 (Plin1) locus. PAM sequences are shown in green, and sgRNA sequences are underlined in black, and the red arrowhead indicates the cleavage site. b Frequency of individual indels at the Plin1 target site in mice treated with 10% or 20% Cas9/sgRNA packaged in VLPs, measured by targeted deep sequencing (10%, 1.50 × 109 VLPs; 20%, 3.00 × 109 VLPs). c Sanger sequencing chromatograms of a Plin1-knockout mouse with 29-base pair (bp) deletion. d Genotypes of the F1 generation obtained from F0 #53 M (Plin1 mutant mouse with 29 bp deletion), determined by next-generation sequencing. e Sanger sequencing chromatogram of an F1 Plin1-knockout mouse containing 29 bp deletion. The red arrowhead represents deletion onset. f Immunofluorescence staining of PLIN1 (red) in epididymal white adipose tissue (eWAT) and inguinal WAT (iWAT) from Plin1 (+/+) and Plin1 (-/-) mice. Nuclei were counterstained with DAPI. Scale bars = 50 μm. g Immunoblot analysis of PLIN1 expression in eWAT and iWAT from Plin1 (+/+) and Plin1 (-/-) mice. h H&E staining in paraffin sections of eWAT and iWAT. Scale bars = 50 μm. i Immunohistochemistry staining of F4/80 in paraffin sections of eWAT and iWAT. Scale bars = 100 μm. n = 3 for Plin1 (+/+) mice and n = 2 for Plin1 (-/-) mice. Source data are provided as a Source Data file.
Fig. 3
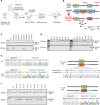
Fig. 3. Gene editing via the CRISPR-VIM method with CRISPR-RNP packaged in VLPs during IVF in mice.
a Scheme of gene editing via the CRISPR-VIM method during IVF in mice. Created in BioRender. Kim, K. (2025) https://BioRender.com/b91u430. b, c Comparison of gene editing efficiencies at Gata3 (b) and Plin1 (c) target sites in groups treated with ABE8e/sgRNA packaged in VLPs during IVF (Gata3: 10%, 1.53 × 109 VLPs; 20%, 3.07 × 109 VLPs; Plin1: 10%, 8.92 × 108 VLPs; 20%, 1.78 × 109 VLPs). d Embryo development rates in experimental groups treated with ABE8e/sgRNA packaged in VLPs during IVF. Numbers above the bars in the graph indicate the number of morula and blastocysts formed from two-cell stage embryos. +, 10% of CRISPR-RNP packaged in VLPs of total medium volume; ++, 20% of CRISPR-RNP packaged in VLPs of total medium volume. e A-to-G conversion efficiency in morula and blastocysts cultured in vitro after treatment with ABE8e/sgRNA packaged in VLPs targeting Tyr post-fertilization stage. 10%, 1.14 × 109 VLPs; 20%, 2.27 × 109 VLPs. f Mutation pattern of representative Tyr-mutant mouse #2 M with the H420R mutation obtained using ABE8e/sgRNA packaged in VLPs via IVF. g Sanger sequencing chromatogram of Tyr mutant mouse #2 M. Red arrowheads indicate A-to-G conversion site. h Genotyping of the Tyr (H420R) F1 generation by next-generation sequencing. i Sanger sequencing chromatograms of a WT mouse and an F1 #1 M (Tyr+/H420R) mutant mouse. The red arrowhead represents A-to-G conversion. j Coat color change of TyrH420R/H420R mutant F2 mice showing the Himalayan phenotype. k Sanger sequencing of Tyr wild-type (Tyr+/+), heterozygous (Tyr+/H420R), and homozygous (TyrH420R/H420R) mutant F2 mice. +, 10% of CRISPR-RNP packaged in VLPs of the total culture medium volume; ++, 20% of CRISPR-RNP packaged in VLPs of the total culture medium volume. All data are shown as the mean ± SD. Source data are provided as a Source Data file.
Fig. 4
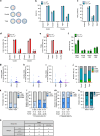
Fig. 4. Base editing using CBE packaged in VLPs in cell lines and mouse zygotes.
a Optimization of processing conditions for AncBE4max/sgRNA (CBE) packaged in existing VLPs (WT) and optimized VLPs (OPT), targeting HEK3 in HEK293T cells (n = 4). b Comparison of C-to-T conversion efficiencies using CBE packaged in WT or OPT VLPs targeting human genes (ADAMTS4, CCR5, HEK3, EMX1, EIF3D, RNF2, and MYOCD) in HEK293T cells (n = 4, p = 0.02, the statistical test used was two-tailed). Data is presented as a box plot with median value. The borders of box represent the first and the third quarter percentiles and the whiskers indicate the highest and lowest value. c C-to-T conversion efficiency at Dnmt1 target using CBE packaged in WT or OPT VLPs at varying volumes in mouse Neuro-2a cells (n = 4). d Comparison of editing efficiencies using CBE packaged in WT or OPT VLPs across various mouse targets (Cftr, Dip2a, F9, Hpd, Rpe65, Dnmt1, Kcnq4, Tyr, and Gjb2) (n = 4, p = 0.02 the statistical test used was two-tailed). Data is presented as a box plot with median value. The borders of box represent the first and third quater percentiles and the whiskers indicate the highest and lowest value. e, f C-to-T conversion efficiencies mediated by CRISPR-VIM in mouse embryos targeting Dnmt1 and Hpd using optimized VLP-packaged CBE (Dnmt1: 10%, 2.31 × 109 VLPs; 20%, 4.62 × 109 VLPs; Hpd: 10%, 2.15 × 108 VLPs; 20%, 4.30 × 109 VLPs). g Mutation patterns and editing efficiency (wild-type: WT, substitution: SUB) in mouse embryos induced by the CRISPR-VIM method with CBE packaged in VLPs. Statistical significance was determined using a paired t test. All data are shown as the mean ± SD. The bar plot values correspond to the mean value of all biological replicates, and the error bars illustrate the SD. ad Source data are provided as a Source Data file.
Fig. 5
Fig. 5. HDR-mediated knock-in via the CRISPR-VIM method with SpCas9/sgRNA packaged in VLPs.
a Schematic of the CRISPR-VIM-based HDR strategy with AAV-based donors in mouse embryos. Created in BioRender. Kim, K. (2025) https://BioRender.com/a99d722. b Strategy for generating a knock-in mouse model where exon 5 and flanking intronic sequences (a total of 728 bp) of the mouse Kcnq4 gene are replaced with human KCNQ4 (hKCNQ4) pathogenic mutation and sequences. c PCR-based genotyping of Kcnq4 knock-in mouse embryos, confirming the introduction of human sequences via the CRISPR-VIM-based HDR approach. d Genotyping analysis of F0 mice demonstrating the successful knock-in of human sequences at the Kcnq4 locus. e Sanger sequencing of F0 mice validating the precise knock-in of human sequences into the Kcnq4 locus. f Germline transmission analysis of humanized KCNQ4 mouse genotypes, shown via gel electrophoresis (left) and Sanger sequencing (right). WT indicates wild-type, and KI indicates knock-in. All experiments were repeated three times independently. Source data are provided as a Source Data file.
Fig. 6
Fig. 6. Multi-target editing using the CRISPR-VIM method with CRISPR-RNPs packaged in VLPs.
a Schematic of multi-target editing via CRISPR-VIM. The combi approach involved packaging two sgRNAs into a single VLP, while the double and triple approaches used separate VLPs for each sgRNA, combining two or three different VLPs to achieve simultaneous gene editing. Created in BioRender. Kim, K. (2025) https://BioRender.com/c06n497. b Editing efficiencies of combi and double approaches targeting Fgfr3 and Kcnq4 in mouse Neuro-2a cells with SpCas9/sgRNA packaged in VLPs (n = 4). c Triple gene editing efficiencies targeting Fgfr3, Kcnq4, and Gata3 in mouse Neuro-2a cells with SpCas9/sgRNA packaged in VLPs (n = 4). d Combi gene editing efficiencies using VLP-packaged ABE8e/sgRNA targeting Gata3 and Kcnq4 in mouse Neuro-2a cells (n = 4). e Triple gene editing for A-to-G base conversion at Gata3, Kcnq4, and Tyr-Ex4 loci using ABE8e/sgRNA in VLPs (n = 4). f Quadruple gene editing efficiencies, showing both desired base substitutions and indel formation at four loci (n = 4). gi Editing efficiencies in mouse embryo using (g) combi gene editing (Plin1+Kcnq4; 20%, 2.57 × 109 VLPs), (h) double gene editing (Plin1, Kcnq4; 1.50 × 109 VLPs), and (i) triple gene editing (Plin1, Kcnq4, Gata3; 1.00 × 109 VLPs) with SpCas9/sgRNA packaged in VLPs. j Gene editing ratio in mouse embryos from combi, double, and triple gene editing approaches. k Genotype distributions of F0 mice produced by combi and triple gene editing. l, m Genotype distributions of the (l) F1 and (m) F2 generations from F0 mice generated via the combi gene editing approach. F1 mice were bred by crossing mosaic and wild-type mice, and F2 mice were generated by crossing heterozygous F1 mice. n Genotype distributions of F2 mice generated through the combi gene editing approach. Numbers within the bars indicate the count of each genotype among all offspring. o Genotype distributions of F2 mice at Gata3 and Kcnq4 loci. Bar plots show mean values ± SD. bf All data are presented as mean ± SD. Source data are provided as a Source Data file.

References

    1. Doudna, J. A. The promise and challenge of therapeutic genome editing. Nature578, 229–236 (2020). - PMC - PubMed
    1. Li, T. et al. CRISPR/Cas9 therapeutics: progress and prospects. Signal Transduct. Target. Ther.8, 36 (2023). - PMC - PubMed
    1. Wang, H. et al. One-step generation of mice carrying mutations in multiple genes by CRISPR/Cas-mediated genome engineering. Cell153, 910–918 (2013). - PMC - PubMed
    1. Komor, A. C., Kim, Y. B., Packer, M. S., Zuris, J. A. & Liu, D. R. Programmable editing of a target base in genomic DNA without double-stranded DNA cleavage. Nature533, 420–424 (2016). - PMC - PubMed
    1. Gaudelli, N. M. et al. Programmable base editing of A*T to G*C in genomic DNA without DNA cleavage. Nature551, 464–471 (2017). - PMC - PubMed

Substances

LinkOut - more resources