. 2025 Apr 11;16(1):3442.
doi: 10.1038/s41467-025-58634-4.

Correction of dysregulated lipid metabolism normalizes gene expression in oligodendrocytes and prolongs lifespan in female poly-GA C9orf72 mice

Affiliations

Correction of dysregulated lipid metabolism normalizes gene expression in oligodendrocytes and prolongs lifespan in female poly-GA C9orf72 mice

Ali Rezaei et al. Nat Commun. .

Abstract

Clinical and genetic research links altered cholesterol metabolism with ALS development and progression, yet pinpointing specific pathomechanisms remain challenging. We investigated how cholesterol dysmetabolism interacts with protein aggregation, demyelination, and neuronal loss in ALS. Bulk RNAseq transcriptomics showed decreased cholesterol biosynthesis and increased cholesterol export in ALS mouse models (GA-Nes, GA-Camk2a GA-CFP, rNLS8) and patient samples (spinal cord), suggesting an adaptive response to cholesterol overload. Consequently, we assessed the efficacy of the cholesterol-binding drug 2-hydroxypropyl-β-cyclodextrin (CD) in a fast-progressing C9orf72 ALS mouse model with extensive poly-GA expression and myelination deficits. CD treatment normalized cholesteryl ester levels, lowered neurofilament light chain levels, and prolonged lifespan in female but not male GA-Nes mice, without impacting poly-GA aggregates. Single nucleus transcriptomics indicated that CD primarily affected oligodendrocytes, significantly restored myelin gene expression, increased density of myelinated axons, inhibited the disease-associated oligodendrocyte response, and downregulated the lipid-associated genes Plin4 and ApoD. These results suggest that reducing excess free cholesterol in the CNS could be a viable ALS treatment strategy.


Conflict of interest statement

Competing interests: L.R.P., N.H., and D.O. are employees of Sanofi, but Sanofi is not actively developing CD-based therapeutics. The remaining authors declare no competing interests.

Figures

Fig. 1
Fig. 1. Cyclodextrin extends lifespan and reduces Neurofilament levels in female GA-Nes mice.
a Gene expression changes in the cholesterol pathway from historical bulk RNAseq dataset in GA-Nes (endstage hippocampus, cortex and spinal cord, 5 control vs 5 GA-Nes mice), GA-CFP (thoracic spinal cord, cohort #1 with 4 wildtype vs. 3 GA-CFP mice 32 weeks of age, cohort #2 with 7 wildtype vs. 6 GA-CFP mice 42 weeks of age) and rNLS8 (hippocampus, after 3 weeks of transgene induction, cohort #1 with 17 wildtype vs. 10 rNLS8 mice, cohort #2 with 11 wildtype and 10 rNLS8 mice) ALS mouse models and patient spinal cord,,. Log2 fold changes compared to controls are shown in the heat map. Adjusted p values from the original analysis are shown because different genotype and species prevent a combined re-analysis with common RNAseq pipelines. Asterisks indicate significant changes. Upregulation of export pathway genes and downregulation of synthesis genes suggest cholesterol overload. b Survival analysis by Kaplan–Meier curve shows that CD administered at 2 g/kg q.d. does not affect the survival of transgenic male mice significantly (p = 0.097 from log-rank test for survival, n = 12 vehicle vs 5 CD). c Survival analysis by Kaplan–Meier curve shows that CD administered at 2 g/kg q.d. significantly improves the survival of transgenic female mice (p = 0.019 from log-rank test for survival, n = 7 vehicle vs 10 CD). d, e Serum NfL from independent cohorts of mice sacrificed at postnatal day 40 (P40) shows significant modulations (female n from independent biological replicates: WT Vehicle = 4, WT CD = 7, Tg Vehicle = 4, Tg CD = 5; male n of independent biological replicates: WT Vehicle = 8, WT CD = 15, Tg Vehicle = 5, Tg CD = 9). Post-hoc analysis by Tukey’s HSD shows a dramatic increase in transgenic mice, which is partially rescued by CD treatment in female but not male mice. CD administration does not modulate wild-type NfL levels. f, g Fluorescence microscopy of endogenous GA-GFP in frozen tissue confirms its neuronal and glial expression in transgenic mice and the lack of expression in wild-type mice, while also highlighting no significant reduction upon CD treatment (ANOVA, post hoc by Tukey’s HSD from three independent biological replicates in each group). All scale bars = 75 µm.
Fig. 2
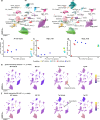
Fig. 2. snRNAseq highlights oligodendrocytes as target of CD therapy by downregulation of genes.
a snRNAseq dimensional reduction plot (UMAP) of WT (90,772 cells from 8 animals) and Tg (66,263 cells from 7 animals) highlights dramatic changes in glial cells. b PCA of all expressed genes by combining all clusters clearly separates the genotypes and partially resolves effects by CD treatment. c, d PCA of all expressed genes in Oligo_mat1 and Oligo_mat2 clusters, respectively, highlights the rescue effect of CD treatment in the clusters of mature oligodendrocytes. e FeaturePlot of genes combined with AddModuleScore that are downregulated (LFC < −1, adjusted p < 0.05) by CD treatment shows that the target of such therapy is primarily oligodendrocytes. f FeaturePlot of genes with color-coded AddModuleScore that are upregulated (LFC > 1, adjusted p < 0.05) by CD treatment shows that the target of such therapy is primarily neuroblasts.
Fig. 3
Fig. 3. poly-GA transgene induces a DOL signature which is rescued by CD treatment.
a Heatmap of previously published DOL genes across oligodendrocyte clusters comparing transgenic effect (n = 3 Tg Vehicle vs n = 4 WT Vehicle) and CD effect (n = 4 Tg CD vs n = 3 Tg Vehicle) as well as bulk RNAseq from the endstage GA-Nes mice (data from, 5 control vs 5 GA-Nes mice) demonstrates induction of DOL genes in the diseased state. CD treatment showcases an appreciable and significant rescue of many of these genes. Asterisks indicate significant changes (p < 0.05). b Volcano plots of the two mature oligodendrocyte clusters demonstrate some overlap with previously published DOL genes as well as other genes such as ApoD, where they get rescued by CD treatment. c SerpinA3N immunofluorescence demonstrates that increased expression of this key DOL marker in transgenic GA-Nes mice is curtailed by CD treatment, confirming the snRNAseq results. Scale bars = 50 µm. Images are representative of two independent experiments. d, e Western blot of hindbrains (n from independent biological replicates: WT vehicle = 3, WT CD = 4, Tg Vehicle = 3, Tg CD = 4) and its quantification confirms the significant induction of Serpin A3N upon transgene expression and its significant rescue upon CD treatment (ANOVA, post hoc by Tukey’s HSD). f IL33, another key DOL marker, measured by MSD V-Plex cytokine panel from hindbrain lysates shows significant modulation of this marker. Post-hoc analysis with Tukey’s HSD highlights upregulation of IL33 in the transgenic condition, which is fully rescued upon CD treatment. The treatment does not modulate IL33 levels in wild-type mice. n from independent biological replicates: WT Vehicle = 4, WT CD = 4, Tg Vehicle = 3, Tg CD = 4.
Fig. 4
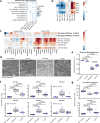
Fig. 4. CD mitigates demyelination-related pathology in GA-Nes mice.
a Gene ontology of genes rescued by CD with |LFC| > 0.5 shows that upregulated genes in Oligo_mat1 and neuroblast cluster are contributing to myelination and axonal development. The number of genes per cell type is indicated in parenthesis. b Heatmap of gene expression of major myelin protein components demonstrates downregulation of myelination in all oligodendrocyte clusters as the result of transgene expression (left block), an effect which is significantly rescued with CD treatment (right block). Asterisks indicate significant changes (adjusted p < 0.05). c A myelin DAM signature is detected in various models of ALS as well as patient spinal cord. Microglia cluster also strongly shows this signature, while CD administration partially alleviates this signature, shifting it more towards the amyloid DAM signature. Asterisks indicate significant changes (adjusted p < 0.05). d, e SEM overview and quantification of corpus callosum shows dramatic loss of myelinated axons upon transgene expression, which is partially but significantly rescued by CD treatment (ANOVA, post hoc by Tukey’s HSD). n from independent biological replicates: WT Vehicle = 3, WT CD = 3, Tg Vehicle = 4, Tg CD = 5. Scale bars = 3 µm. f Measurements of cholesteryl ester species by mass spectrometry demonstrate significant upregulation in transgenic condition and CD-mediated rescue of CE 16:1, CE 18:1, and CE 22:4. CE 18:2, CE 20:4, and CE 22:6 were not significantly modulated (ANOVA with Fisher’s LSD post-hoc). n from independent biological replicates: WT Vehicle = 4, Tg Vehicle = 3, Tg CD = 5. g Total unmodified cholesterol and cholesteryl esters (from peak area sum) confirm downregulation of cholesterol in transgenic condition, which is not affected by CD. Cholesteryl esters are upregulated in GA-Nes mice, which is rescued by CD (ANOVA with Fisher’s LSD post-hoc. n from independent biological replicates: WT Vehicle = 4, Tg Vehicle = 3, Tg CD = 5).
Fig. 5
Fig. 5. Plin4 production is upregulated in oligodendrocytes, and rescued by CD treatment.
a FeaturePlot of PLIN4 shows upregulation of its expression in GA-Nes mice and rescue by CD treatment. Major glia types are clustered as indicated. b Percentage of mature oligodendrocytes expressing more than one copy of PLIN4 (raw count) is dramatically increased with the expression of the GA transgene, and partially rescued by CD treatment. Data is generated per each animal from the snRNAseq data (ANOVA, post hoc by Tukey’s HSD; n = 4 WT Vehicle, n: WT CD, n = 3 Tg Vehicle, n = 4 Tg CD). c PLIN4 (green) immunofluorescence co-stained with DAPI and CA2 (red) confirm the transgenic upregulation and rescue by CD. White arrows indicate examples of CA2+ oligodendrocytes. Scale bars = 50 µm; Shown images are adjusted for brightness and contrast in the same way for each channel across all conditions. d Quantification of percentage of PLIN4+ oligodendrocytes in hippocampus highlights a dramatic increase of such oligodendrocytes with the expression of the transgene, and a near-complete rescue by CD treatment. n = 3 in each of the four conditions, from independent biological replicates (ANOVA, post hoc by Tukey’s HSD). Quantification was performed exclusively on raw images.
Fig. 6
Fig. 6. DOLs are found in other ALS mouse models.
a Heatmap of DOL marker genes and essential cholesterol pathway genes from bulk RNAseq across three mouse models of ALS confirms induction of DOLs and the disturbance of cholesterol pathway. Asterisks indicate significant changes (adjusted p < 0.05). (n as Fig. 1a for GA-Nes and rNLS8 mice. GA-Camk2a hippocampi from 5 control vs 6 transgenic mice. GA-Camk2a neocortex from 4 control vs 6 transgenic mice). b, c SerpinA3N staining in rNLS mice shows significant expression of Serpina3n mRNA in the transgenic condition. n: WT = 4, Tg = 5 from independent biological replicates. (Welch’s T-test) d, e SerpinA3N staining in GA-Camk2a mice shows significant expression of Serpina3n mRNA in the transgenic condition. n: WT = 4, Tg = 4 from independent biological replicates (Mann–Whitney U-Test). f PLIN4 (green) immunofluorescence co-stained with DAPI and oligodendrocyte marker CA2 (red) in Camk2a (control) and GA-Camk2a (transgenic) mice, respectively, confirms upregulation of PLIN4 in transgenic mice, both in oligodendrocytes as well as elsewhere. The shown images are adjusted for brightness and contrast in the same way for each channel in similar ways across both conditions. White arrow indicates an example of a CA2+ oligodendrocyte, yellow arrow shows an example of axon tracts, while magenta arrow highlights an example of PLIN4 in the neuropil. Images are representative of three animals. Scale bar = 50 µm.

References

    1. Hardiman, O. et al. Amyotrophic lateral sclerosis. Nat. Rev. Dis. Prim.3, 17071 (2017). - PubMed
    1. Feldman E. L. et al. Amyotrophic Lateral Sclerosis (Lancet, 2022). - PMC - PubMed
    1. Mackenzie, I. R. et al. Dipeptide repeat protein pathology in C9ORF72 mutation cases: clinico-pathological correlations. Acta Neuropathol.126, 859–879 (2013). - PubMed
    1. Neumann, M. et al. TDP-43-positive white matter pathology in frontotemporal lobar degeneration with ubiquitin-positive inclusions. J. Neuropathol. Exp. Neurol.66, 177–183 (2007). - PubMed
    1. Murray, M. E. et al. Clinical and neuropathologic heterogeneity of c9FTD/ALS associated with hexanucleotide repeat expansion in C9ORF72. Acta Neuropathol.122, 673–690 (2011). - PMC - PubMed

MeSH terms