. 2025 Apr 11;16(1):3450.
doi: 10.1038/s41467-025-58662-0.

Natural killer cells' functional impairment drives the immune escape of pre-malignant clones in early-stage myelodysplastic syndromes

Affiliations

Natural killer cells' functional impairment drives the immune escape of pre-malignant clones in early-stage myelodysplastic syndromes

Juan Jose Rodriguez-Sevilla et al. Nat Commun. .

Abstract

Dissecting the preneoplastic disease states' biological mechanisms that precede tumorigenesis can lead to interventions that can slow down disease progression and/or mitigate disease-related comorbidities. Myelodysplastic syndromes (MDS) cannot be cured by currently available pharmacological therapies, which fail to eradicate aberrant hematopoietic stem cells (HSCs), most of which are mutated by the time of diagnosis. Here, we sought to elucidate how MDS HSCs evade immune surveillance and expand in patients with clonal cytopenias of undetermined significance (CCUS), the pre-malignant stage of MDS. We used multi-omic single-cell approaches and functional in vitro studies to show that immune escape at disease initiation is mainly mediated by mutant, dysfunctional natural killer (NK) cells with impaired cytotoxic capability against cancer cells. Preclinical in vivo studies demonstrated that injecting NK cells from healthy donors efficiently depleted CCUS mutant cells while allowing normal cells to regenerate hematopoiesis. Our findings suggest that early intervention with adoptive cell therapy can prevent or delay the development of MDS.


Conflict of interest statement

Competing interests: All authors declare no competing interests relative to this work.

Figures
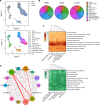
Fig. 1
Fig. 1. Immune cells are activated in patients with CCUS.
A UMAP plots of scRNA-seq data from BM MNCs isolated from 2 yHDs (n = 6,494), 2 eHDs (n = 3,719), and 3 patients with CCUS (n = 11,981). Each dot represents one cell. Numbering and/or colors represent the sample origin (top) and cell identity (bottom). HSPC, hematopoietic stem and progenitor cell; cDC, classic dendritic cell; pDC, plasmacytoid dendritic cell; RBC, red blood cell. B Frequencies of different cell subsets in BM MNCs from yHDs, eHDs, and CCUS patients were analyzed using scRNA-seq. Colors are coded as in A, and cell populations are organized in the same order as in the legend, in a clockwise direction. C Pathway enrichment analysis of genes that were significantly (P adj ≤ 0.05) upregulated (top) or downregulated (bottom) in immune cell subsets from CCUS patients compared with those from eHDs. The top 10 Reactome or KEGG gene sets are shown, respectively. D Connectome web analysis of interacting MNC types isolated from the BM of CCUS patients compared with those isolated from the BM of eHDs and yHDs. The vertex size is proportional to the number of CCUS-specific interactions to and from each cell type, and the thickness of each connecting line is proportional to the number of interactions between two nodes. A one-sided permutation test was used to determine if a pair was significant. HSPC, hematopoietic stem and progenitor cell; RBC, red blood cell; pDC, plasmacytoid dendritic cell; cDC, classic dendritic cell. Source data are provided as a Source Data file.
Fig. 2
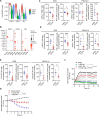
Fig. 2. NK cells from patients with CCUS are dysfunctional.
A Differentiation scores of CD4+ T, CD8+ T, and NK cells from CCUS patients compared with those from eHDs and yHDs. B Normalized expression levels of exhaustion markers in CD4+ T, CD8+ T, and NK cells from CCUS patients, eHDs, and yHDs. C IFN-γ expression in CD8+ T cells from eHDs or CCUS patients after stimulation with K562 cells (left; n = 8 and n = 12, respectively) or phorbol myristate acetate/ionomycin (PMA/Iono; right; n = 7 and n = 9, respectively). The IFN-γ+ CD8+ T cell frequency and the median fluorescence intensity (MFI) of IFN-γ in CD8+ T cells are shown. Lines represent the mean ± standard deviation. Statistical significance was calculated using unpaired two-tailed t-tests. *P < 0.05; ****P < 0.0001. K562, IFN-γ MFI in IFN-γ+: P = 0.0113. D IFN-γ expression in NK cells from eHDs or CCUS patients after stimulation with K562 cells (left; n = 10 and n = 12, respectively) or MOLM-14 cells (right; n = 5 and n = 6, respectively). Lines represent the mean ± standard deviation. Statistical significance was calculated using unpaired two-tailed t-tests. *P < 0.05; ***P < 0.001; ****P < 0.0001. K562, IFN-γ MFI in IFN-γ+: P = 0.002. MOLM-14, % IFN-γ: P = 0.0161; IFN-γ MFI in IFN-γ+: P = 0.0124. E CD16 expression in NK cells isolated from eHDs or CCUS patients after stimulation with K562 cells (left; n = 10 and n = 12, respectively) or MOLM-14 cells (right; n = 5 and n = 6, respectively). The CD16+ NK cell frequency and the MFI of CD16 in NK cells are shown. Lines represent the mean ± standard deviation. Statistical significance was calculated using unpaired two-tailed t-tests. **P < 0.01; ****P < 0.0001. MOLM-14, % CD16+: P = 0.0092; CD16 MFI in CD16+: P = 0.0091. F Numbers of live K562 cells during 48 h of incubation alone or in co-culture with NK cells isolated from yHDs (n = 3), eHDs (n = 4), and patients with CCUS (n = 4). Symbols and lines represent the mean ± standard deviation. Statistical significance was calculated using one-way ANOVA of the area under the curve using Tukey’s multiple comparisons test. ****P < 0.0001. G Numbers of live CD34+ cells from patients with CCUS during 24 h of incubation alone or in co-culture with allogeneic NK cells isolated from eHDs (n = 2) or other patients with CCUS (n = 4). Symbols and lines represent the mean ± standard deviation. Statistical significance was calculated using one-way ANOVA of the area under the curve using Tukey’s multiple comparisons test. ***P < 0.001. CCUS vs eHD: P = 0.0008. Source data are provided as a Source Data file.
Fig. 3
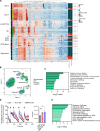
Fig. 3. Somatic mutations in MDS driver genes induce CCUS NK cell dysfunction.
A Single-cell genotypes of BM MNCs (n = 2,518), by immunophenotype, from a representative CCUS patient (CCUS-52) with DNMT3A (VAF = 15%) and TP53 (VAF = 13%) mutations. Each line represents a cell. The heatmap represents antibody signal intensity; each column represents one surface marker. The colored bars to the left of the heatmap represent different cell types based on the antibody intensity. The colors and percentages in the sidebars to the right of the heatmap show each cell type’s genotype. Immunophenotypes and genotypes are unaligned. Lymph, lymphoid; Prog, progenitors; cDCs, classic dendritic cells; pDCs, plasmacytoid dendritic cells; Mono, monocytes; Myelomono, myelomonocytic; Ab, antibody; WT, wild type; MUT, mutated; MISS, missing. B UMAP plot of long-read scRNA-seq data from BM MNCs isolated from 2 CCUS patients (n = 52,751) and two eHDs (n = 52,330). Different colors represent cell identity and genotype. RBC Prec, red blood cell precursors; HSPC, hematopoietic stem and progenitor cell; Myelomono, myelomonocytic. C Pathway enrichment analysis of genes that were significantly downregulated (P ≤ 0.05) in CCUS mutant NK cells compared to CCUS non-mutant NK cells. The top 10 Reactome gene sets are shown. D Number of live THP-1 cells co-cultured with HD NK cells transfected with Cas9 in the absence (Cas9; control) or presence of sgRNAs against TET2 (TET2 KO) or DNMT3A (DNMT3A KO) after 5 rounds of tumor cell challenge (black arrows). The experiment was performed twice using 2 independent guides per gene. Symbols and lines represent the mean ± standard deviation of tumor indexes in three biological replicates from one representative experiment (left) and the corresponding areas under the curve (AUC; right). Statistical significance was calculated using one-way ANOVA of the AUC using Dunnett’s multiple comparisons test. *P < 0.05, **P < 0.01. Cas9 vs TET2 KO: P = 0.0067; Cas9 vs DNMT3A KO: P = 0.0242. E Pathway enrichment analysis of genes that were significantly downregulated (P adj ≤ 0.05) after 5 tumoral challenges in both TET2-KO and DNMT3A-KO NK cells but not in Cas9 controls. The top 10 Reactome gene sets are shown. Source data are provided as a Source Data file.
Fig. 4
Fig. 4. NK cells from HDs efficiently target CCUS mutant cells.
A Frequencies of MDS-L cells in the BM (left) and spleen (right) of engrafted NSGS mice 10 days after the injection of NK cells transfected with Cas9 in the absence (Cas9; n = 8) or presence of sgRNAs against TET2 (TET2 KO; n = 6) or DNMT3A (DNMT3A KO; n = 6). Statistical significance was calculated using one-way ANOVA and Tukey’s multiple comparisons test. **P < 0.01, ****P < 0.0001. BM, TET2 KO vs DNMT3A KO: P = 0.0035; spleen, TET2 KO vs DNMT3A KO: P = 0.0084. hCD45, human CD45. Error bars represent the mean ± standard deviation. B PB blood counts in engrafted NSGS mice 10 days after the injection of NK cells transfected with Cas9 (n = 8) in the absence or presence of sgRNAs against TET2 (n = 6) or DNMT3A (n = 6). Dotted lines represent the mean of hemoglobin, white blood cell counts, and platelets for 8 week-old NSGS mice based on the Mouse Phenome Database (Jackson Laboratories). Statistical significance was calculated using one-way ANOVA and Tukey’s multiple comparisons test. *P < 0.05, **P < 0.01, ****P < 0.0001. Hemoglobin, Cas9 vs DNMT3A KO: P = 0.004; TET2 KO vs DNMT3A KO: P = 0.0651. White blood cells (WBC), Cas9 vs TET2 KO: P = 0.005; Cas9 vs DNMT3A KO: P = 0.0103; TET2 KO vs DNMT3A KO: P = 0.9445. Platelets, TET2 KO vs DNMT3A KO: P = 0.1041. Error bars represent the mean ± standard deviation. C Kaplan–Meier survival analysis of NSGS mice transplanted with MDS-L cells injected with vehicle (n = 5) or NK cells transfected with Cas9 in the absence (n = 8) or presence of sgRNAs targeting TET2 (n = 8) or DNMT3A (n = 8). Statistical significance was calculated using a log-rank (Mantel-Cox) analysis adjusted by Holm’s multiple comparisons test. ***P < 0.001. Vehicle vs Cas9: P = 0.0002; Vehicle vs TET2 KO: P = 0.0002; Vehicle vs DNMT3A KO: P = 0.0002; TET2 KO vs DNMT3A KO: P = 0.2036. D Frequencies of human CD45+CD56- cells in the BM of MISTRG mice transplanted with cells from 4 patients with CCUS. Samples were analyzed 1 week after the injection of vehicle (n = 3/each) or HD NK cells (n = 3/each). Dotted lines are color-coded and represent the mean of each group. Statistical significance between treatment groups was calculated using a two-tailed nested t-test. *P < 0.05. Vehicle vs NK cells: P = 0.0486. Error bars represent the mean ± standard deviation. E VAF in mouse CD45-depleted and human CD45-enriched BM cells isolated from MISTRG donor mice transplanted with cells from 2 CCUS patients 1 week after the injection of vehicle (n = 3/each) or healthy NK cells (n = 3/each). Dotted lines are color-coded and represent the mean of each group. Statistical significance between treatment groups was calculated using a two-tailed nested t-test. *P < 0.05. Vehicle vs NK cells: P = 0.0279. Error bars represent the mean ± standard deviation. Source data are provided as a Source Data file.

References

    1. Ganan-Gomez, I. et al. Stem cell architecture drives myelodysplastic syndrome progression and predicts response to venetoclax-based therapy. Nat. Med.10.1038/s41591-022-01696-4 (2022). - PMC - PubMed
    1. Malcovati, L. et al. Clinical significance of somatic mutation in unexplained blood cytopenia. Blood129, 3371–3378 (2017). - PMC - PubMed
    1. Steensma, D. P. et al. Clonal hematopoiesis of indeterminate potential and its distinction from myelodysplastic syndromes. Blood126, 9–16 (2015). - PMC - PubMed
    1. Osman, A. When are idiopathic and clonal cytopenias of unknown significance (ICUS or CCUS)? Hematol. Am. Soc. Hematol. Edu. Prog.2021, 399–404 (2021). - PMC - PubMed
    1. de Visser, K. E. & Joyce, J. A. The evolving tumor microenvironment: From cancer initiation to metastatic outgrowth. Cancer Cell41, 374–403 (2023). - PubMed