

doi: 10.1038/s41514-025-00218-z.
1H-NMR-based metabolomics identifies disrupted betaine metabolism as distinct serum signature of pre-frailty
Affiliations
- PMID: 40216769
- PMCID: PMC11992162
- DOI: 10.1038/s41514-025-00218-z
Item in Clipboard
1H-NMR-based metabolomics identifies disrupted betaine metabolism as distinct serum signature of pre-frailty
NPJ Aging.
.
Abstract
Increasing evidence suggests that frailty results from a complex age-associated metabolic decline. Here, we investigated the serum metabolomic profile of a well-characterized cohort of elderly subjects encompassing the whole fit-to-frail continuum. Enrichment analyses revealed a complex dysregulation of amino acids and energy metabolism in both pre-frail and frail participants. Remarkably, upregulated betaine levels emerged as a specific biochemical signature of pre-frail females, holding promise for the development of novel targeted interventions.
© 2025. The Author(s).
Conflict of interest statement
Competing interests: The authors declare no competing interests.
Figures
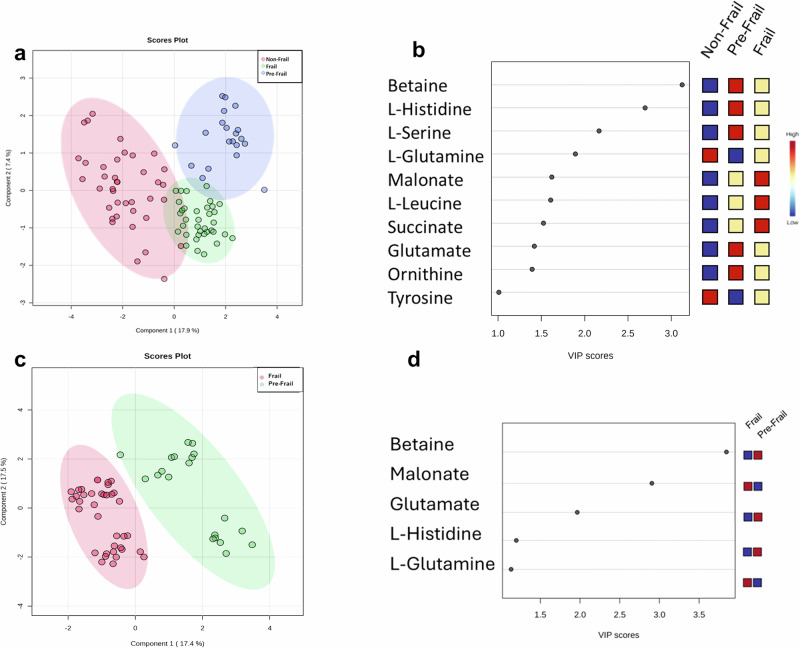
a PLS-DA score scatter plots related to serum from pre-frail (n = 20), frail (n = 37) and non-frail participants (n = 39). The cluster analyses are reported in the Cartesian space described by the main components PC1:17.9% and PC2:7.4%. PLS-DA was evaluated using cross-validation (CV) analysis. CV tests performed according to the PLS-DA statistical protocol show a significant cluster separation (0.93 and 0.97 accuracy PC1 and PC2, respectively, with positive 0.78 and 0.79 Q2 indices). b VIP score graphs of metabolites discriminating the three clusters. c PLS-DA score scatter plots related to serum from pre-frail (n = 20), and frail subjects (n = 37). The cluster analyses are reported in the Cartesian space described by the main components PC1:17.4% and PC2:17.5%. PLS-DA was evaluated using cross-validation (CV) analysis. CV tests performed according to the PLS-DA statistical protocol show a significant cluster separation (0.76 and 0.87 accuracy PC1 and PC2 respectively, with positive 0.69 and 0.75 Q2 indices). d VIP score graphs of metabolites discriminating the two clusters.
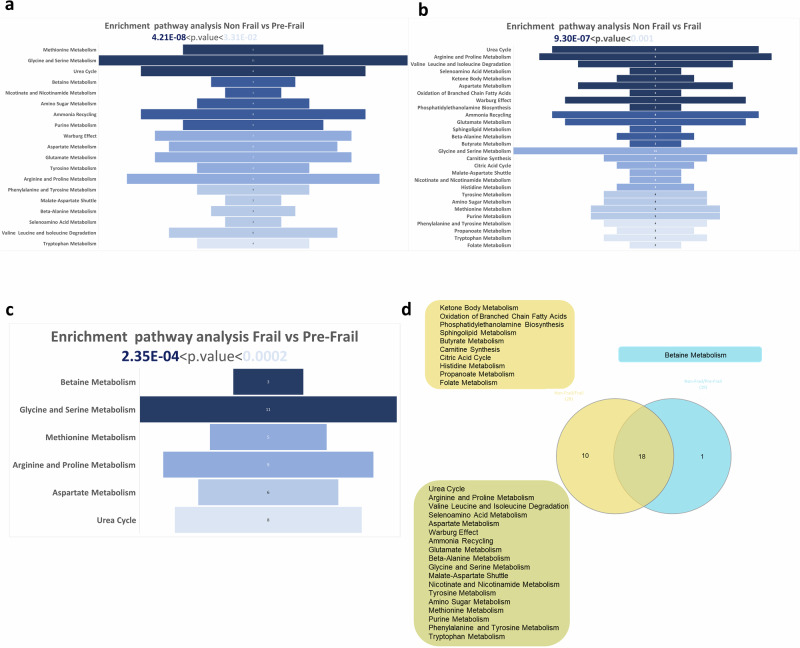
Enrichment pathways analysis performed comparing a non-frail vs pre-frail, b non-frail vs frail and c frail vs pre-frail subjects. The discriminative pathways are ranked according to p-value and number of hits reported in the bars. d Venn diagram displaying the disrupted pathways emerged from the comparisons of frail and pre-frail subjects with non-frail controls. Blue box reports the unique pathway dysregulated in pre-frail but not in frail subjects; light yellow box reports the pathways enriched in frail but not in pre-frail subjects; dark yellow box reports the common pathways dysregulated in both frail and pre-frail participants.
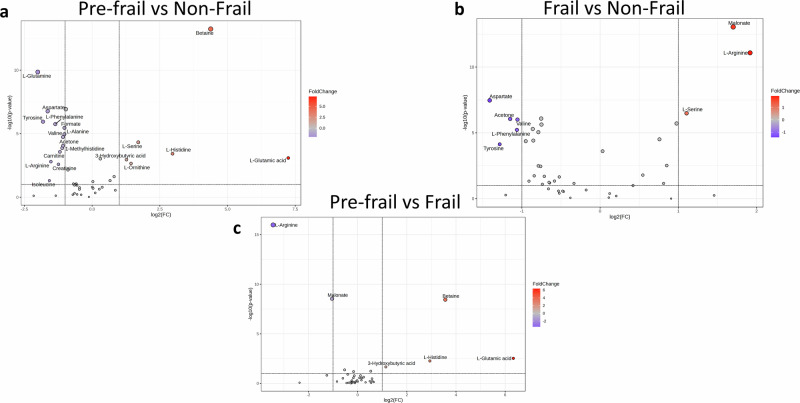
a–c Volcano plot analyses of metabolic changes in pre-frail vs non-frail, frail vs non-frail and pre-frail vs frail subjects’ serum. Each point on the volcano plot was based on p- and fold-change values, set at 0.05 and 1.0, respectively. Red and blue circles identify upregulated and downregulated metabolites, respectively. Variations are expressed as follows: panels a-b are graphed as a function of pathological group; panel c is graphed as a function of pre-frail group.
References
-
- Hoogendijk, E. O. et al. Frailty: implications for clinical practice and public health. Lancet394, 1365–1375 (2019). - PubMed
-
- Fried, L. P. et al. Frailty in older adults: evidence for a phenotype. J. Gerontol. Ser. A Biol. Sci. Med. Sci.56, 146–157 (2001). - PubMed
-
- Trevisan, C. et al. Factors influencing transitions between frailty states in elderly adults: the progetto Veneto Anziani longitudinal study. J. Am. Geriatr. Soc.65, 179–184 (2017). - PubMed
-
- Gill, T. M., Gahbauer, E. A., Allore, H. G. & Han, L. Transitions between frailty states among community-living older persons. Arch. Intern. Med.166, 418–423 (2006). - PubMed
Grants and funding
LinkOut - more resources
Full Text Sources
