. 2025 Apr 12;16(1):3483.
doi: 10.1038/s41467-025-58519-6.

Autophagy is induced during plant grafting to promote wound healing

Affiliations

Autophagy is induced during plant grafting to promote wound healing

Ken-Ichi Kurotani et al. Nat Commun. .

Abstract

Grafting is an agricultural technique that joins tissues from different plants to obtain useful rootstock traits. However, cellular processes involved in joint tissue repair remain poorly understood. We analyzed Nicotiana benthamiana (Nb) and Arabidopsis thaliana (At) interfamily heterografting as a high-stress model and At homografting as a low-stress model. Transmission electron micrographs reveal the formation of autophagic structures in cells near the graft boundary over a long period in Nb/At interfamily grafts and in a short period of a few days in At homografts. Using a GFP-ATG8 marker line, the autophagosomes were observed in the cells near the graft boundary, especially on the scion side, where nutrient depletion occurred. Grafting of At autophagy-defective mutants decreases grafting success rates and post-grafting growth. NbATG5 knockdown suppresses graft establishment in Nb/At interfamily heterografts. Moreover, At autophagy-defective mutants show reduced callus formation directed to wounds under the nutrient-deficient conditions. These results suggest that autophagy is induced during grafting, promoting callus formation and contributing to tissue connectivity.


Conflict of interest statement

Competing interests: The authors declare no competing interests.

Figures

Fig. 1
Fig. 1. Autophagic structures in cells near the graft boundary.
a Schematic image of Nb/At interfamily hetero-graft. b, c TEM images of the Nb/At hetero-grafts at 14 days after grafting (DAG). Representative images from 5 biological replicates are shown. b Image of the boundary cells. c Magnified image of a boundary Nb cell. d TEM images of the cross section of Nb intact stem. Representative images from 2 biological replicates are shown. e–h GFP fluorescence signals of GFP-ATG8 in grafting stem of Nb/At heterografts at 14 DAG. Representative images from 4 biological replicates are shown. e, f GFP signal. g, h Marge images of GFP and bright field. f, h Magnified images of the squares in (e, g). Red and white dashed line indicates the Nb/At graft boundary. Red and white arrowheads indicate autophagosomes. Bars = 10 µm (b, d), 5 µm (c) and 100 µm (eh).
Fig. 2
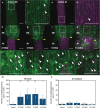
Fig. 2. Observation of Nb/At hypocotyl micrografting.
a–d Images of the Nb/At hypocotyl grafting. a An Nb/At hypocotyl on the micrografting chip just after grafting. Dashed rectangle indicates the area of (b). b A magnified image of (a). c An image of Nb/At grafted hypocotyl at 6 DAG. Dashed rectangle indicates the area of (d). d A magnified image of (c). Yellow arrowheads indicate the grafted position. Bars = 500 µm (ad). eg Autophagic structures in the cells of the Nb/At hypocotyl graft. Images of scanning electron microscopy (SEM) in the Nb/At hetero-grafts at 5 DAG. Representative images from 5 technical replicates are shown. f, g Magnified images of the area of dashed rectangle in (e, f). The red dashed line indicates the graft boundary. Red arrowheads indicate autophagosomes. Bars = 50 µm (e), 10 µm (f) and 1 µm (g).
Fig. 3
Fig. 3. GFP-ATG8 observation of Nb/At hypocotyl micrografting.
a–l GFP and RFP fluorescence signals detected in the intact Nb and At and the Nb/At heterografted hypocotyls with a confocal laser scanning microscope. a,b GFP fluorescence image in the intact Nb hypocotyl. c, d RFP fluorescence image in the intact At hypocotyl. e–l Merged fluorescence images of GFP and RFP in the Nb/At grafted hypocotyls observed at 2 (e, f), 3 (g, h), 5 (i, j), and 14 DAG (k, l). b,d,f,h,j,l Magnification images of (a, c, e, g, i, k). Dashed rectangles in (a, c, e, g, i, k) indicate the areas of (b, d, f, h, j, l), respectively. Yellow arrowheads indicate the grafted positions. White arrowheads indicate examples of autophagosomes. Not all autophagosomes are indicated. Bars = 100 µm. m, n Quantification of autophagosomes in the image of maximum intensity projections of the intact Nb (a), the intact At (c), and the Nb scion and At rootstock (e, g, i, k). Error bars represent standard deviation. Asterisks indicate statistically significant differences compared with intact hypocotyls as determined by one-way analysis of variance (ANOVA; P < 0.05) followed by Dunnett’s multiple comparison test (* P < 0.05, ** P < 0.01). Sample sizes: (m): Intact (n = 7), 2 DAG (n = 9), 3 DAG (n = 6), 5 DAG (n = 10), 14 DAG (n = 8); (n): Intact (n = 9), 2 DAG (n = 9), 3 DAG (n = 7), 5 DAG (n = 10), 14 DAG (n = 8). All experiments were independently performed twice with similar results.
Fig. 4
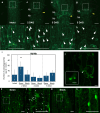
Fig. 4. GFP-ATG8 observation in Nb/Nb hypocotyl homo-grafting.
ah Representative GFP fluorescence signals detected in grafting of Nb hypocotyls of GFP-ATG8 plants with a confocal laser scanning microscope. Maximum intensity projections of z-stacks. a, b Intact Nb. c, d 2 DAG. e, f 3 DAG. g, h 5 DAG. b, d, f, h Magnification images of (a, c, e, g). Yellow dashed lines indicate the grafting boundary. White arrowheads indicate autophagosomes. Bars =100 µm. i Quantification of autophagosomes in the image of maximum intensity projections of (a, c, e, g). Error bars represent standard deviation. Asterisks indicate statistically significant differences compared with intact hypocotyls as determined by one-way ANOVA (P < 0.05) followed by Dunnett’s multiple comparison test (** P < 0.01). Sample sizes: Intact (n = 8); 2 DAG: Scion (n = 9), Stock (n = 9); 3 DAG: Scion (n = 6), Stock (n = 6); 5 DAG: Scion (n = 8), Stock (n = 8). j Fluorescent image of GFP-ATG8 observed in a ring shape, a characteristic structure of autophagosome, in the scion of the Nb/Nb graft. Bar =100 µm. A magnified image of the bright spot pointed by the arrowhead is shown in inset. Bar =20 µm. k–n Accumulation of GFP-ATG8 vesicles in the vacuoles upon concanamycin A treatment in the Nb/Nb grafts expressing GFP-ATG8. k, l Images of the scion side of the grafted hypocotyl. m, n Images of the rootstock side of the grafted hypocotyl. Dashed rectangles in (k, m) indicate the areas of (l, n), respectively. White arrowheads indicate autophagic body in the vacuoles. Bars =100 µm (k, m) and 50 µm (l, n). All experiments were performed three times independently.
Fig. 5
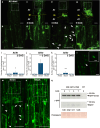
Fig. 5. GFP-ATG8 observation in At/At homo-grafting.
ah Representative GFP fluorescence signals detected in grafting of At hypocotyls of GFP-ATG8 plants with a confocal laser scanning microscope. Maximum intensity projections of z-stacks. a,b Intact At. c,d 2 DAG. e,f 3 DAG. g,h 5 DAG. b, d, f, h Magnification images of dashed rectangle areas in (a, c, e, g). Yellow dashed lines indicate the grafting boundary. White arrowheads indicate autophagosome points. Bars = 50 µm. ik Quantification of autophagosomes in the image of maximum intensity projections of (a, c, e, g). Error bars represent standard deviation. Asterisks indicate statistically significant differences compared with intact hypocotyls as determined by one-way ANOVA (P < 0.05) followed by Dunnett’s multiple comparison test (* P < 0.05, ** P < 0.01; n = 12). l Fluorescent image of GFP-ATG8 observed in a ring shape, a characteristic structure of autophagosome. Bars =100 µm. A magnified image of the bright spot pointed by the arrowhead is shown in inset. Bar =20 µm. m–p Accumulation of GFP vesicles in the vacuoles upon concanamycin A treatment. m, n Images of the scion side of the grafted hypocotyl. o, p Images of the rootstock side of the grafted hypocotyl. Dashed rectangles in (m, o) indicate the areas of (n, p), respectively. White arrowheads indicate autophagic body in the vacuoles. Bars =100 µm (m, o) and 50 µm (n, p). q Representative data of ATG8 cleavage in At hypocotyl grafting using an anti-GFP antibody. The top panel shows the signal corresponding to GFP-ATG8 and the middle panel shows the ATG8-cleavaged GFP signal. The bottom panel shows a membrane-stained image with Ponceau S to ensure uniformity of loading. The numbers at the bottom of the middle panel show the relative intensity of ATG8-cleavaged GFP at each time when the signal intensity of intact is set to 1.00. All experiments were performed three times independently.
Fig. 6
Fig. 6. Autophagy contributed to wound healing in At/At homo- and Nb/At hetero-grafting.
a Success rate of WT and atg2 mutant grafts onto WT rootstock at 14 DAG. Error bars represent standard deviation. Asterisk indicates a statistically significant difference as determined by χ2 test (*P < 0.05; n = 81 and 38 for WT/WT and atg5/WT, respectively). b, c VIGS experiment targeting NbATG5 was performed in the Nb/At stem grafting. b Suppression of NbATG5 expression by VIGS was verified by qRT-PCR (three grafts were conducted for each sample fraction). Expression levels were normalized against the reference gene NbACT1 and adjusted to be relative to the sample with no virus infection (NI). Error bars represent standard deviation. Asterisks indicate statistically significant differences as determined by two-way ANOVA (P < 0.05) followed by Tukey’s post-hoc test (*P < 0.05, **P < 0.01; n = 3). c Effect of suppression of NbATG5 expression by VIGS on graft establishment. Experiments were performed three times. For each experiment, 10 grafts were conducted for each sample fraction. Asterisk indicates a statistically significant difference as determined by χ2test (*P < 0.05, **P < 0.01).
Fig. 7
Fig. 7. Autophagy was required for callus formation under nutrient-deficient conditions.
a Phosphorus transport in an intact Nb plant, an Nb/At homo-graft and an Nb/At hetero-graft. All plantlets incorporated inorganic phosphate (Pi) labeled with 32P from the cut stems. The signal amount is shown as a heat map; the gradient from white to blue corresponds to higher to lower signals. Insets indicate the reference points to compare the signal intensity. Arrowheads indicate the grafted position. Bars = 5 cm. b Quantification of Pi transport by imaging plates at 6 h after application. Error bars represent standard deviation. Differences between the sample groups were tested using two-way ANOVA followed by a Tukey’s post-hoc test (P < 0.01; biological replicates: n = 13, 13 and 11 for intact Nb, Nb/Nb and Nb/At in 3 DAG, and 11, 12 and 13 for intact Nb, Nb/Nb and Nb/At in 7 DAG, respectively). c Expression levels of genes responsive to nutrient starvation. The expression levels of Nb genes were established by transcriptomic analysis of the intact Nb, Nb/Nb, and Nb/At grafted samples. d–f Callus formed at the lower end of the cut hypocotyl under carbon-deficient conditions in wild type (d), atg2 (e) and atg5 (f). The hypocotyls were cut at 7 days after germination and cultured for 11 days on MGRL medium without sucrose as carbon source. Experiments were performed three times. For each experiment, 30 seedlings were observed. Bars = 200 µm. g Frequency of callus formation in wild type, atg2, and atg5 plants grown for 11 days after hypocotyl cutting on normal MGRL medium, carbon-depleted (-C), nitrogen-depleted (-N), and both carbon and nitrogen-depleted (-C-N) MGRL medium. Three independent trials were averaged. Error bars represent standard deviation. Asterisks indicate statistically significant differences compared with WT as determined by one-way ANOVA (P < 0.05) followed by Dunnett’s multiple comparison test (*P < 0.05, ** P < 0.01; n = 3). h Total area of callus formed per plant in wild type, atg2 and atg5 cultured for 11 days after hypocotyl cutting on normal MGRL medium, carbon-depleted (-C), nitrogen-depleted (-N), and depleted of both carbon and nitrogen (-C-N) MGRL medium. The numbers in the graph indicate the number of outliers above the scale. Error bars represent standard deviation.Asterisks indicate statistically significant differences compared with WT as determined by one-way ANOVA (P < 0.05) followed by Dunnett’s multiple comparison test (*P < 0.05, ** P < 0.01; n = 79, 71 and 64 for WT, atg2 and atg5 in +NC, 86, 47 and 54 for WT, atg2 and atg5 in -C, 77, 62 and 63 for WT, atg2 and atg5 in -N, 55, 35 and 43 for WT, atg2 and atg5 in -N-C). i, j Comparison of callus formation frequency (i) and the area of callus formed per plant (j) in wild type, atg2 and atg5 cultured for 11 days after hypocotyl cutting on carbon deficient MGRL medium (blue) and carbon deficient MGRL medium supplemented with 0.1 g/L casamino acid (right blue). A box plot represents the interquartile range from the first quartile to the third quartile. The horizontal line inside the box indicates the median. The whiskers extend to cover 95% of the data range. The number of outliers that fell outside the plot frame is indicated at the top of each graph. Error bars represent standard deviation. Asterisks indicate statistically significant differences in Student’s T test (*P < 0.05, ** P < 0.01; n = 3 for (i), n = 67, 75, 36, 64, 29 and 57 for WT (-C), WT (-C + A), atg2 (-C), atg2 (-C + A), atg5 (-C) and atg5 (-C + A) in (j)). k Model for wound healing processes in grafting.

References

    1. Davies, Jr. F. T., Geneve, R. L. & Wilson, S. B. Hartmann & Kester’s Plant Propagation: Principles and Practices, 9thedn. 490–542 (Pearson, NY,2018).
    1. Gaut, B. S., Miller, A. J. & Seymour, D. K. Living with two genomes: grafting and its implications for plant genome-to-genome interactions, phenotypic variation, and evolution. Annu. Rev. Genet.53, 51–5.21 (2019). - PubMed
    1. Thomas, H. R. & Frank, M. H. Connecting the pieces: uncovering the molecular basis for long-distance communication through plant grafting. N. Phytol.223, 582–589 (2019). - PubMed
    1. Notaguchi, M. et al. Cell-cell adhesion in plant grafting is facilitated by β-1,4-glucanases. Science369, 698–702 (2020). - PubMed
    1. Kurotani, K. et al. Host-parasite tissue adhesion by a secreted type of β-1,4-glucanase in the parasitic plant Phtheirospermum japonicum. Commun. Biol.3, 407 (2020). - PMC - PubMed

MeSH terms

Substances