. 2025 Apr 11;15(1):142.
doi: 10.1038/s41398-025-03338-y.

A role for astrocytic miR-129-5p in frontotemporal dementia

Affiliations

A role for astrocytic miR-129-5p in frontotemporal dementia

Lalit Kaurani et al. Transl Psychiatry. .

Abstract

Frontotemporal dementia is a debilitating neurodegenerative disorder characterized by frontal and temporal lobe degeneration, resulting in behavioral changes, language difficulties, and cognitive decline. In this study, smallRNA sequencing was conducted on postmortem brain tissues obtained from the frontal and temporal of FTD patients with GRN, MAPT, or C9ORF72 mutations. Our analysis identified miR-129-5p as consistently deregulated across all analyzed mutation conditions and brain regions. Functional investigations in in-vitro models revealed a novel role of miR-129-5p in astrocytes, where its loss led to neuroinflammation and impaired neuronal support functions, including reduced glutamate uptake. Depletion of miR-129-5p in astrocytes also resulted in the loss of neuronal spines and altered neuronal network activity in a cell culture system. These findings highlight miR-129-5p as a potential therapeutic target in neurodegenerative diseases and also sheds light on the role of astrocytes in Frontotemporal dementia pathogenesis.


Conflict of interest statement

Competing interests: The authors declare no conflict of interest.

Figures
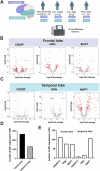
Fig. 1
Fig. 1. Differential microRNA expression the frontal and temporal lobe of FTD patients.
A Schematic representation of the study design. B Volcano plot showing microRNA expression in the frontal lobe of control vs FTD patients with C9ORF72, GRN or MAPT mutations. The plot illustrates the relationship between log2 fold change (log2FC) and statistical significance (-log10 of the adjusted p-value, padj). C Volcano plot showing microRNA expression in the temporal lobe of control vs FTD patients with C9ORF72, GRN or MAPT mutations. The plot illustrates the relationship between log2 fold change (log2FC) and statistical significance (-log10 of the adjusted p-value, padj). D Bar plot illustrating the total number of differentially expressed microRNAs in the frontal and temporal lobes, obtained by summing the data from all three mutations. E Bar plot depicting the number of differentially expressed microRNAs in the frontal and temporal lobes for each individual FTD mutation. For information of brain samples see Supplemental Table 1. In the Volcano plots, dots in pink color illustrates miRs with an adjusted p-value < 0.05, while red colored dots indicate miRs with an adjusted p-value < 0.1 and a log2 fold change of +/−0.2. Significantly altered miRs with basemean ≥50 were considered.
Fig. 2
Fig. 2. GO terms for the target genes of microRNAs commonly deregulated in the frontal and temporal lobe of FTD patients.
A Venn diagram showing that 30 microRNAs (see also Supplemental Table 3) are commonly deregulated in the frontal lobe of all analyzed samples. B Venn diagram showing that 5 microRNAs (see Supplemental Table 3) are commonly deregulated in the temporal lobe of all analyzed samples. C Representative GO terms based on the commonly deregulated miRNAs in the frontal lobe (upper panel) and the temporal lobe (lower panel).
Fig. 3
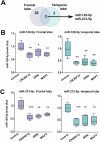
Fig. 3. Deregulation of miR-212-5p and miR-129-5p in FTD.
A Venn diagram showing that miR-212-5p and miR129-5p are commonly deregulated in FTD patients. B The qPCR results depict the expression of miR-129-5p in the frontal lobe (Left panel; one-way ANOVA (F(3,18) = 7.967, p = 0.0014, R2 = 0.5704), followed by Tukey’s multiple comparison test for post-hoc analysis. Significant differences were observed between the NDC group and all patient groups: NDC vs. C9 (p = 0.0008), NDC vs. GRN (p = 0.0281), and NDC vs. MAPT (p = 0.0021) and temporal lobe (Right panel; one-way ANOVA (F(3,17) = 11.15, p = 0.0003, R2 = 0.6630), followed by Tukey’s multiple comparison test for post-hoc analysis. Significant differences were observed between the NDC group and all patient groups: NDC vs. C9 (p = 0.0007), NDC vs. GRN (p = 0.0011), and NDC vs. MAPT (p = 0.0005) of both control and FTD patients (n = 5/group). C The qPCR results depict the expression of miR-212-5p in the frontal lobe (Left panel; one-way ANOVA (F(3,16) = 18.67, p < 0.0001, R2 = 0.7778), followed by Tukey’s multiple comparison test for post-hoc analysis. Significant differences were observed between the NDC group and all patient groups (NDC vs. C9: p < 0.0001; NDC vs. GRN: p < 0.0001; NDC vs. MAPT: p = 0.0005) and temporal lobe (Right panel; one-way ANOVA (F(3,16) = 10.52, p = 0.0005, R2 = 0.6637), followed by Tukey’s multiple comparison test for post-hoc analysis. Significant differences were observed between the NDC group and all patient groups (NDC vs. C9: p = 0.0008; NDC vs. GRN: p = 0.0021; NDC vs. MAPT: p = 0.0028) of both control and FTD patients (n = 5/group). The horizontal line in the box plot represents the median, the box spans 25 and 75% quantile, and the whiskers represent the smallest and largest values in the 1.5× interquartile range. (*P < 0.05; **P < 0.01, ***P < 0.001; t-test unpaired; 2-tailed).
Fig. 4
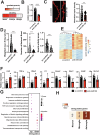
Fig. 4. Knock down of miR-129-5p in PNM cultures impairs neuronal function and leads to deregulated gene-expression.
A Heat map showing the expression of miR-129-5p in different neural cell types. B Bar plot showing qPCR analysis of miR-129-5p levels in PNM cultures upon anti-miR-129 administration. When compared to the control group miR-129-5p expression is significantly reduced. Data was normalized to U6 expression. ****P < 0.0001, two-tailed, unpaired t-test (n = 6 per group). C Left panel: Representative confocal images of neuronal dendrites from sc-control and anti-miR-129 treated PNM cultures. Right panel shows the quantification of dendritic spines (number of total spines per length of a chosen dendritic segment). Anti-miR-129 treated neurons displayed a significantly reduced number of dendritic spines (number of dendritic segments analyzed: scramble control = 31, miR-129-5p inhibitor = 32. **P < 0.01, Unpaired t-test, two-tailed). D Bar plots showing the results of multielectrode array (MEA) experiments in anti-miR-129-5p-treated PNM cultures compared to the sc-control group. Comparison of the weighted mean firing rate (left panel), the number of network bursts (middle panel) and the neuronal activity score (right panel) were impaired in anti-miR-129-5p-treated PNM cultures when compared to the sc-control group. A total of 29 recordings per group were conducted, with n = 6 samples per group (unpaired, two-tailed t-test was performed, *P < 0.05, **P < 0.01, ***P < 0.001). E Heatmap displaying gene expression changes in PNM cultures upon anti-miR-129 treatment (log2foldchange ± 0.4, and adjusted p-value < 0.05). F Bar plots showing qPCR results for selected up- or downregulated genes detected via RNA seq (n = 6/group, two-tailed, unpaired t-test; *P < 0.05, **P < 0.01, ***P < 0.001). G A dot plot is presented, illustrating the GO term analysis of the differentially expressed genes shown in (E). To aid visualization, similar GO terms were clustered using GO semantic similarity, and the parental GO term was highlighted. H Heat map showing the cell type enrichment of genes identified in (E) using published datasets to detect neuronal and astrocytic genes. P-values are based on hypergeometric testing to detect overlap between deregulated genes with published datasets from neuron, microglia and astrocytes (Fisher’s exact test, adjusted p-value with Benjamini-Hochberg (BH) correction). The color key reflects the odds ratios derived from the cell type enrichment analysis. Darker shades correspond to higher odds ratios, indicating a stronger enrichment of deregulated genes for a specific cell type, while lighter shades represent lower odds ratios, suggesting less enrichment. The visual gradation from light to dark therefore encapsulates the varying degrees of gene enrichment across different cell types. Error bars = mean ± SD.
Fig. 5
Fig. 5. miR-129-5p controls astrocytic gene-expression, cytokine levels and glutamate uptake.
A qPCR analysis of miR-129-5p expression in primary astrocyte (DIV12) culture 48 h after anti-miR-129 or sc-control treatment(***P < 0.001 for anti-miR-129 treated cell compared to the sc-control condition, two-tailed, unpaired t-test; n = 6 per group. B Heatmap displaying gene expression analysis (basemean ≥ 50, log2foldchange ± 0.4, and adjusted p-value < 0.05) in primary astrocytes treated with anti-miR-129 or sc-control. C A dot plot is utilized to illustrate the GO term analysis of the genes shown in (B). D Bar plots showing qPCR analysis for inflammatory cytokines TNF-a, Il1b and Il6. (n = 6, unpaired t-test; two-tailed, ***P < 0.0001 for anti-miR-129 treated cells vs sc-control group). E The plots display eigen-expression calculated based on qPCR results, comparing the expression of Cacna1c, Cacna1d, Cacna2d1, and Cacna2d3 (calcium channels, left panel), and Scl1a1, Slc1a2, and Scl1a3 (glutamate transporters, right panel) in anti-miR-129 treated astrocytes versus sc-control treated astrocytes (n = 6, unpaired t-test; two-tailed, ***P < 0.001). F Bar plot showing the results of a glutamate uptake assay in astrocytes (n = 4, unpaired t-test; two-tailed, **P < 0.01, from anti-miR-129 treated cells vs sc-control group). Error bars indicate mean ± SD.
Fig. 6
Fig. 6. Reduced miR-129-5p levels in astrocytes affect neuronal structure and plasticity.
A Schematic representation of the co-culturing experiment. B In the left panel, representative images of dendrites from PMN cultures are shown, to which astrocytes treated with sc-control or anti-miR-129 had been transferred. The right panel presents a bar graph quantifying dendritic spines. A total of 41 dendritic segments were analyzed for PMN cultures treated with sc-control, while 42 segments were analyzed for anti-miR-129-5p treated astrocytes (n = 6/group). An unpaired, two-tailed t-test was conducted (***P < 0.001). C PMN cultures were grown on Axion MEA plates, while primary astrocytes were initially cultured in T-75 flasks. At DIV 10, astrocytes were treated with anti-miR-129- or sc-control. At DIV 12 the astrocytes were co-cultured with the PMN cultures on the MEA plates. Spontaneous neuronal activity was recorded every hour for 10 min, with the entire recording session spanning 29 h. The bar plots show the results of MEA experiments. Comparison of the weighted mean firing rate (left panel), the number of network bursts (middle panel) and the neuronal activity score (right panel) were impaired in PNM that were co-cultures with astrocytes treated with anti-miR-129. A total of 29 recordings per group were conducted, with n = 6 samples per group. An unpaired, two-tailed t-test was performed (**P < 0.01 anti-miR-129 vs sc-control). Error bars indicate mean ± SD.

References

    1. Younes K, Miller BL. Frontotemporal dementia: neuropathology, genetics, neuroimaging, and treatments. Psychiatr Clin North Am. 2020;43:331–44. - PubMed
    1. Wagner M, Lorenz G, Volk AE, Brunet T, Edbauer D, Berutti R, et al. linico-genetic findings in 509 frontotemporal dementia patients. Mol Psychiatry. 2021;26:5824–32. - PMC - PubMed
    1. Ratnavalli E, Brayne C, Dawson K, Hodges JR. The prevalence of frontotemporal dementia. Neurology. 2002;58:1615–21. - PubMed
    1. Mackenzie IR, Neumann M. Molecular neuropathology of frontotemporal dementia: insights into disease mechanisms from postmortem studies. J Neurochem. 2016;138:54–57. - PubMed
    1. Greaves CV, Rohrer JD. An update on genetic frontotemporal dementia. J Neurol. 2019;266:2075–86. - PMC - PubMed

LinkOut - more resources