Identification of osteoarthritis-associated chondrocyte subpopulations and key gene-regulating drugs based on multi-omics analysis
- PMID: 40216809
- PMCID: PMC11992032
- DOI: 10.1038/s41598-025-90694-w
Identification of osteoarthritis-associated chondrocyte subpopulations and key gene-regulating drugs based on multi-omics analysis
Abstract
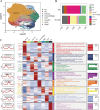
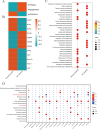
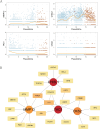
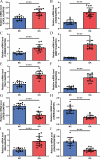
The mechanism by which chondrocytes respond to mechanical stress in joints significantly affects the balance and function of cartilage. This study aims to characterize osteoarthritis-associated chondrocyte subpopulations and key gene targets for regulatory drugs. To begin, single-cell and transcriptome datasets were obtained from the Gene Expression Omnibus (GEO) database. Cell communication and pseudo-temporal analysis, as well as High-dimensional Weighted Gene Co-expression Network Analysis (hdWGCNA), were conducted on the single-cell data to identify key chondrocyte subtypes and module genes. Subsequently, Consensus Cluster Plus analysis was utilized to identify distinct disease subgroups within the osteoarthritis (OA) training dataset based on the key module genes. Furthermore, differential gene expression analysis and GO/KEGG pathway enrichment analysis were performed on the identified subgroups. To screen for hub genes associated with OA, a combination of 10 machine learning algorithms and 113 algorithm compositions was integrated. Additionally, the immune and pathway scores of the training dataset samples were evaluated using the ESTIMATE, MCP-counter, and ssGSEA algorithms to establish the relationship between the hub genes and immune and pathways. Following this, a network depicting the interaction between the hub genes and transcription factors was constructed based on the Network Analyst database. Moreover, the hub genes were subjected to drug prediction and molecular docking using the RNAactDrug database and AutoDockTools. Finally, real-time fluorescence quantitative PCR (RT-qPCR) was employed to detect the expression of hub genes in the plasma samples collected from osteoarthritis patients and healthy adults. In the OA sample, there is a significant increase in the proportion of prehypertrophic chondrocytes (preHTC), particularly in subgroups 6, 7, and 9. We defined these subgroups as OA_PreHTC subgroups. The OA_PreHTC subgroup exhibits a higher communication intensity with proliferative-related pathways such as ANGPTL and TGF-β. Furthermore, two OA disease subgroups were identified in the training set samples. This led to the identification of 411 differentially expressed genes (DEGs) related to osteoarthritis, 2485 DEGs among subgroups, as well as 238 intersecting genes and 5 hub genes (MMP13, FAM26F, CHI3L1, TAC1, and CKS2). RT-qPCR results indicate significant differences in the expression levels of five hub genes and their related TFs in the clinical blood samples of OA patients compared to the healthy control group (NC). Moreover, these five hub genes are positively associated with inflammatory pathways such as TNF-α, JAK-STAT3, and inflammatory response, while being negatively associated with proliferation pathways like WNT and KRAS. Additionally, the five hub genes are positively associated with neutrophils, activated CD4 T cell, gamma delta T cell, and regulatory T cell, while being negatively associated with CD56dim natural killer cell and Type 17T helper cell. Molecular docking results reveal that CAY10603, Tenulin, T0901317, and Nonactin exhibit high binding activity to CHI3L1, suggesting their potential as therapeutic drugs for OA. The OA_PreHTC subgroups plays a crucial role in the occurrence and development of osteoarthritis (OA). Five hub genes may exert their effects on OA through interactions with PreHTC cells, other chondrocytes, and immune cells, playing a role in inhibiting cell proliferation and stimulating inflammation, thus having high diagnostic value for OA. Additionally, CAY10603, Tenulin, T0901317, and Nonactin have potential therapeutic effects for OA patients.
Keywords: Bioinformatics; Machine learning; Molecular docking; Osteoarthritis; Single cell analysis.
© 2025. The Author(s).
Conflict of interest statement
Declarations. Competing interests: The authors declare no competing interests. Ethics approval and consent to participate:: The samples were obtained from peripheral blood of clinical osteoarthritis patients (5 cases) and healthy adults (5 cases) in the Second Affiliated Hospital of Inner Mongolia Medical University (ethical review number: YKD202002055). Consent for publication: All authors have reached consensus and agreed to publish. Informed consent: All participants (or sample donors) signed informed consent forms prior to participating in the study. We thoroughly explained the research purpose, procedures, potential risks, and rights protection to the participants.
Figures


References
-
- Li, C. et al. Directed differentiation of human pluripotent stem cells into articular cartilage reveals effects caused by absence of WISP3, the gene responsible for progressive pseudorheumatoid arthropathy of childhood. Ann. Rheum. Dis.66, 580 (2023). - PubMed
MeSH terms
Grants and funding
- 2021GG0174/Science and Technology Planning Project of Inner Mongolia Science and Technology Department
- 2022YFSH0022/Science and Technology Planning Project of Inner Mongolia Science and Technology Department
- 2022YFSH0020/Science and Technology Planning Project of Inner Mongolia Science and Technology Department
- 2020GG0195/Science and Technology Planning Project of Inner Mongolia Science and Technology Department
- 2022YFSH0021/Science and Technology Planning Project of Inner Mongolia Science and Technology Department
- 2022YFSH0024/Science and Technology Planning Project of Inner Mongolia Science and Technology Department
- NJZZ22665/Inner Mongolia Education Department Project
- QNLC-20200030/Inner Mongolia Medical University Youth Leader Creates "Bone to Tendon" Mission Group
- 202202403/The Joint Project of the Health Commission of Inner Mongolia Autonomous Region
- discipline construction/Support the reform and development funds of local colleges and universities
- ZY20242146/Inner Mongolia Medical University "Zhiyuan" Talent Plan
LinkOut - more resources
Full Text Sources
Medical
Research Materials
Miscellaneous

