. 2025 Apr 11;15(1):12496.
doi: 10.1038/s41598-025-85893-4.

Integrated single cell and bulk RNA sequencing analyses reveal the impact of tryptophan metabolism on prognosis and immunotherapy in colon cancer

Affiliations

Integrated single cell and bulk RNA sequencing analyses reveal the impact of tryptophan metabolism on prognosis and immunotherapy in colon cancer

Yanyan Hu et al. Sci Rep. .

Abstract

Tryptophan metabolism is intricately associated with the progression of colon cancer. This research endeavored to meticulously analyze tryptophan metabolic characteristics in colon cancer and forecast immunotherapy responses. This study analyzed colon cancer samples from a training cohort of 473 tumors and 41 normal tissues from TCGA, with validation in 902 cancer patients across multiple GEO datasets. Patients were stratified into subtypes through consistent clustering, and a tryptophan metabolic risk score model was constructed using the random forest algorithm. Based on these risk scores, patients were delineated into high and low-risk groups, and their clinicopathologic characteristics, immune cell infiltration, immune checkpoint expression, and signaling pathway disparities were examined. The Oncopredict algorithm facilitated the identification of sensitive chemotherapeutic agents, while the immune escape score was employed to evaluate the immunotherapy response across risk groups. Transcriptomic sequencing findings were corroborated by single-cell sequencing from Shanghai Ruijin Hospital. Two distinct subtypes of colon cancer patients emerged, exhibiting significant prognostic and immune cell infiltration differences. The high-risk group demonstrated a poorer prognosis (p < 0.001), advanced clinical stage (p < 0.001), and elevated immunosuppressive cell expression (p < 0.05). Additionally, three chemotherapeutic drugs showed efficacy in the high-risk cohort, displaying a heightened immune escape potential (p < 0.05) and diminished response to immunotherapy. Single-cell sequencing validated the overexpression of tryptophan-related genes in epithelial cells. In conclusion, tryptophan metabolism significantly influences the colon cancer immune microenvironment, with high-risk patients experiencing adverse prognoses and potentially reduced efficacy of immunotherapy.

Keywords: Colon cancer; Immunotherapy; Prognosis; Risk score; Tryptophan metabolism.


Conflict of interest statement

Declarations. Competing interests: The authors declare no competing interests.

Figures

Fig. 1
Fig. 1
Genetic and transcriptional alterations of tryptophan metabolism genes in colon cancer. (A) Frequency and type of mutations in tryptophan metabolism. (B) CNV mutations are widely found in the genes with tryptophan metabolism including gain or loss. (C) CNV alteration on chromosome of tryptophan metabolism from 1 to 22. (D) The mRNA expression levels of tryptophan metabolism genes in carcinoma and adjacent tissues in TCGA. CNV,Copy Number Variation.* p < 0.05, * p < 0.01 and *** p < 0.001.
Fig. 2
Fig. 2
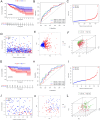
Identification of tryptophan metabolic typing and scoring model construction in colon cancer. (A) When K = 2, the component difference is obvious. (B) PCA analysis of the transcriptomic profiles of the two subtypes. (C) The difference of survival prognosis between the two subtypes was significant. (D) The RF algorithm is more stable than the SVM because of having lower residual values. (E) The random forest algorithm was used to select genes with an importance score greater than 10. (F) The forest plot shows the HR values and risk coefficient of risk score characteristic genes. PCA,Principal Component Analysis; RF,Random Forest; SVM, Support Vector Machine; HR; Hazard Ratio. * p < 0.05, ** p < 0.01 and *** p < 0.001.
Fig. 3
Fig. 3
Validation of the risk score model in the TCGA and GEO independent cohorts. (A) Kaplan–Meier curve of OS in TCGA high-risk and low-risk patients. (B) The time-dependent ROC curve for the TCGA risk score. (C) The high-risk group of patients in the TCGA cohort had a high risk score (D) Patients in the high-grade group in the TCGA had lower survival days. (E) PCA showed that the TCGA high-risk and low-risk groups had identifiable dimensions. F 3dPCA showed that the TCGA high-risk group and the low-risk group can be well distinguished. (G) Kaplan–Meier curve of OS in GEO high-risk and low-risk patients. (H) The time-dependent ROC curve for the GEO risk score. (I) The high-risk group of patients in the TCGA cohort had a high risk score (J) Patients in the high-grade group in the TCGA had lower survival days. (K) PCA showed that the GEO high-risk and low-risk groups had identifiable dimensions (L) 3dPCA showed that the GEO high-risk group and the low-risk group can be well distinguished. OS, Overall Survival; TCGA, The Cancer Genome Atlas; ROC,Receiver Operating Characteristic Curve; PCA,Principal Component Analysis; 3dPCA,3d Principal Component Analysis; GEO,Gene Expression Omnibus.
Fig. 4
Fig. 4
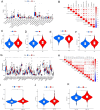
Immune cell infiltration and functional differences and chemotherapy drug screening in the high-risk and low-risk groups. (A) GSVA enrichment analysis provides insights into the biological pathways and processes that are differentially activated or suppressed between the two groups. (B) The high-risk group had a high drug sensitivity for erlotinib. (C) The high-risk group had a high drug sensitivity for gefitinib. (D) The high-risk group had a high drug sensitivity for SB505124. GSEA,Gene-set enrichment analysis;GSVA,Gene set variation analysis.* p < 0.05, ** p < 0.01 and *** p < 0.001.
Fig. 5
Fig. 5
Characteristics of the immune microenvironment and the prediction of immunotherapy in the high-risk and low-risk groups. (A) Differential analysis of tumor-infiltrating immune cells between high-risk groups and low-risk groups. (B) Correlation between the risk score model and tumor-infiltrating immune cells. (C) Immune score, (D) Stroma matrix score, (E) Tumor purity and (F) Estimate score between high-risk and low-risk groups. (G) Differential analysis of immune checkpoint between high-risk group and low-risk groups. (H) Correlation analysis between score model and immune checkpoint. (I) The TIDE score were higher in the high-risk group. (J) The T cell functional exclusion score were higher in the high-risk group. (K) The T cell dysfunction score were higher in the high-risk group. TIDE,Tumor immune dysfunction and rejection.* p < 0.05, ** p < 0.01 and *** p < 0.001.
Fig. 6
Fig. 6
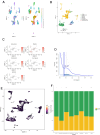
Single-cell transcriptome analysis of the expression of signature genes for tryptophan metabolism in the tumor microenvironment. (A) Single-cell sequencing data of four intestinal cancer samples were combined and divided into 18 clusters. (B) After dimensionality reduction, the cluster cells are annotated as 8 cell subsets. (C) Expression activity of characteristic genes for tryptophan metabolism in epithelial cells. (D) The threshold was selected for 4661 cells at 0.068. (E) AUC score projection of tryptophan metabolism genes for all cells. (F) Stacked map of cell components in the AUC score group. AUC,area under the curve.* p < 0.05, ** p < 0.01 and *** p < 0.001.
Fig. 7
Fig. 7
Analyzes cell communication and pathway differences using single-cell data. (A) Circle diagram showing the interaction of ligand-target and ligand-receptor interactions. (B) Ligand receptor pairs reported in the network. (C) Differences in metabolic pathways between AUC_high and AUC_low groups. AUC,area under the curve.

Similar articles

References

    1. Tan, S. et al. Exosomal cargos-mediated metabolic reprogramming in tumor microenvironment. J. Exp. Clin. Cancer Res.42(1), 59. 10.1186/s13046-023-02634-z (2023). - PMC - PubMed
    1. Nong, S. et al. Metabolic reprogramming in cancer: Mechanisms and therapeutics. MedComm4(2), e218. 10.1002/mco2.218 (2023). - PMC - PubMed
    1. Wang, Z. et al. Amino acid metabolic reprogramming in tumor metastatic colonization. Front. Oncol.13, 1123192. 10.3389/fonc.2023.1123192 (2023). - PMC - PubMed
    1. Sivanand, S. & Vander Heiden, M. G. Emerging roles for branched-chain amino acid metabolism in cancer. Cancer Cell.37(2), 147–156. 10.1016/j.ccell.2019.12.011 (2020). - PMC - PubMed
    1. Chen, J. L. et al. The integrated bioinformatic analysis identifies immune microenvironment-related potential biomarkers for patients with gestational diabetes mellitus. Front. Immunol.15, 1296855. 10.3389/fimmu.2024.1296855 (2024). - PMC - PubMed

LinkOut - more resources