. 2025 Apr 12;16(1):3481.
doi: 10.1038/s41467-025-58708-3.

Myeloid lineage C3 induces reactive gliosis and neuronal stress during CNS inflammation

Affiliations

Myeloid lineage C3 induces reactive gliosis and neuronal stress during CNS inflammation

Thomas Garton et al. Nat Commun. .

Abstract

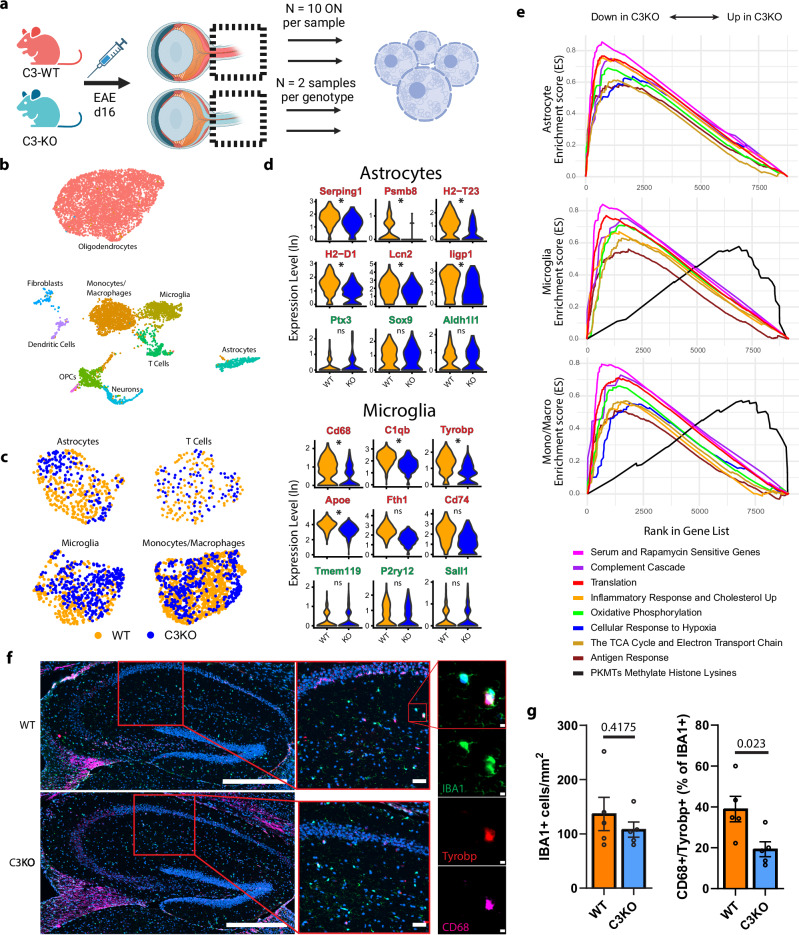
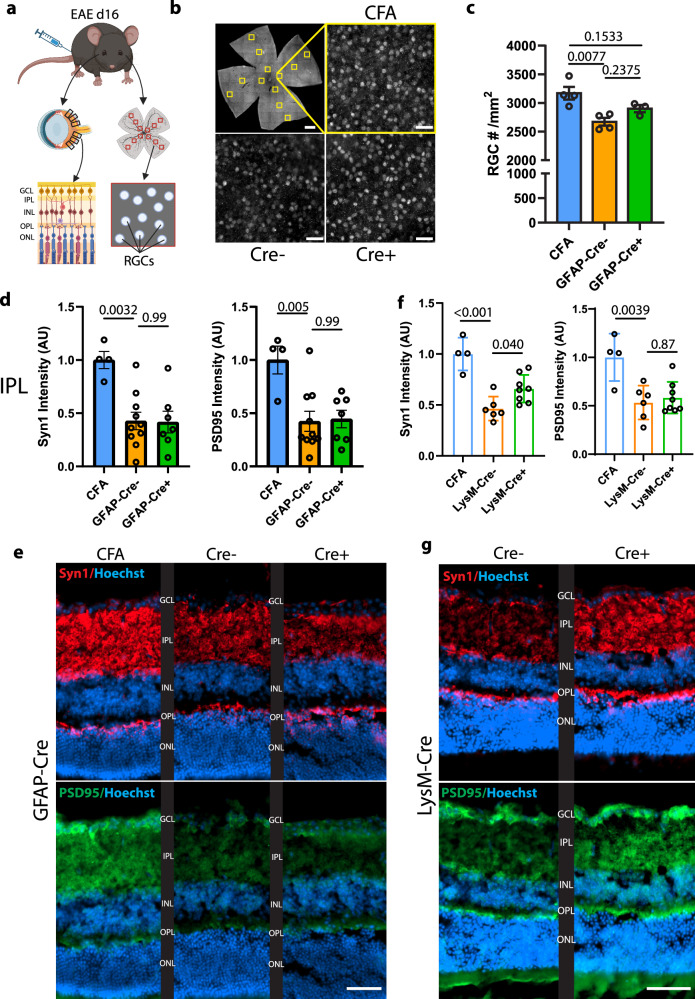
Complement component C3 mediates pathology in CNS neurodegenerative diseases. Here we use scRNAseq of sorted C3-reporter positive cells from mouse brain and optic nerve to characterize C3 producing glia in experimental autoimmune encephalomyelitis (EAE), a model in which peripheral immune cells infiltrate the CNS, causing reactive gliosis and neuro-axonal pathology. We find that C3 expression in the early inflammatory stage of EAE defines disease-associated glial subtypes characterized by increased expression of genes associated with mTOR activation and cell metabolism. This pro-inflammatory subtype is abrogated with genetic C3 depletion, a finding confirmed with proteomic analyses. In addition, early optic nerve axonal injury and retinal ganglion cell oxidative stress, but not loss of post-synaptic density protein 95, are ameliorated by selective deletion of C3 in myeloid cells. These data suggest that in addition to C3b opsonization of post synaptic proteins leading to neuronal demise, C3 activation is a contributor to reactive glia in the optic nerve.


Conflict of interest statement

Competing interests: The authors declare no competing interests.

Figures

Fig. 1
Fig. 1. Single cell RNA-sequencing of C3-tdTomato mice reveals that myeloid cells have distinct populations defined by expression of C3 in the setting of EAE.
a Schematic of the C3-tdTomato reporter, showing the insertion of an IRES site and reporter gene following the final C3 exon, with flanking loxP sites allowing for excision by a Cre recombinase. As a nonfusion reporter, the tdTomato remains intracellular following expression allowing for identification of C3-producing cells. b Experimental paradigm. EAE was induced in 6 mice allowing for 3 independent replicates of 2 pooled brains and spinal cords each. For each replicate, sorting was performed on CD45, CD11b, ACSA2, and tdTomato to collect tdTomato+ and tdTomato myeloid cells, and an astrocyte-enriched third sample. c UMAP plot of integrated dataset with key populations (from the CD45+ sorted samples) colored while the CD45 ACSA2+ sample is in grey. Each cluster is annotated with cell identity (the cluster labeled N/A was not able to be identified). d, e Hierarchical subclustering and reanalysis of microglia and monocytes/macrophages separately with the tdTomato+ sample highlighted in orange and the tdTomato sample highlighted in blue. f, Volcano plot showing DEGs in microglia based on tdTomato expression. A positive log fold change represents genes upregulated in tdTomato+ microglia. Dashed yellow lines represent FDR of 0.05 (horizontal) and log2FC of +/− 1 (vertical lines). g, GSEA indicating directionality of pathways in C3-tdTomato+ microglia compared to C3-tdTomato microglia. Normalized enrichment scores indicated in parentheses. h as in (f) but for C3-tdTomato+ monocytes/macrophages. i as in (g) but for monocytes/macrophages. j, UMAP plot of the captured T cells showing diverse subtypes with cells from the tdTomato+ sort in orange, cells from the tdTomato CD11b+ sort in blue, and cells from the ACSA2+ sort in grey. k Volcano plot of DEGs in T cells based on C3-tdTomato expression. Figure 1a created in BioRender. Smith, M. (2025) https://BioRender.com/w65n506. Figure 1b created in BioRender. Smith, M. (2025) https://BioRender.com/e30b984.
Fig. 2
Fig. 2. EAE mice harbor two distinct C3+ microglial populations including a MIMS-like phenotype that is enriched in lysosomal clearance pathways.
a Violin graphs showing expression of 16 MIMS markers in C3-tdTomato+ (orange) and C3-tdTomato (blue) microglia. N = 3 samples. Asterisks next to the gene name denotes that comparison has FDR < 0.05. FDR value derived from pseudobulk differential expression test with edgeR. b Violin graphs showing the 16 canonical MIMS markers broken down over each microglial subcluster. Orange clusters are the two C3+ tdTomato+ clusters. c Panel of selected markers for cluster 3 and cluster 5. d, e GSEA indicating directionality of pathways in cluster 3 and 5 respectively. Pathways that peak on the left are upregulated in that cluster. Normalized Enrichment Score is included in parentheses after the pathway name.
Fig. 3
Fig. 3. Single nucleus RNA-sequencing from optic nerves reveals that global C3 depletion results in widespread alterations in transcription characterized by a reduction in reactive glial profiles.
a Experimental paradigm. 10 C3KO mice and 10 WT mice were immunized and carried out to the peak of disease (PID 16). 5 mice were pooled per sample, resulting in 10 optic nerves per sample that were flash frozen and from which nuclei were extracted. snRNA-seq analysis was performed on the resulting 4 samples. b Annotated integrated UMAP plot of nuclei captured from optic nerves of N = 2 WT samples and N = 2 C3KO samples (See Fig. S8 for full UMAP and cluster identification markers). c Hierarchical subclustering and reanalysis of four key cell types showing cells from WT samples in orange and cells from C3KO samples in blue. d Specific gene changes in astrocytes and microglia. Gene names in red indicate MIMS and TIC-responsive genes in microglia and astrocytes respectively. Green gene names indicate homeostatic or neuroprotective genes. FDR < 0.1 denoted with an asterisk. e GSEA of DEGs in C3KO vs WT astrocytes (top), microglia (middle), and monocytes/macrophages (bottom). Color scheme for each pathway indicated below the GSEA plots. Pathways with peaks on the left are downregulated in C3KO cells. All shown pathways have FDR < 0.05. f Representative image of immunofluorescent staining of hippocampi from the mice used for the optic nerve snRNA-seq experiment (top is WT, bottom is C3KO). CA-1 region used for quantification highlighted. Inset depicts an example of an IBA1+ CD68+ Tyrobp+ cell from a WT mouse. Scale bar = 500 μM in low magnification view of hippocampus, 50 μM in high magnification insets, and 5 μM in single cell magnification insets. g Quantification of IBA1+ CD68+ Tyrobp+ cells in the CA-1 region of the hippocampus (N = 5 mice per genotype, WT average final EAE score = 2.3 +/− 0.24; C3KO average final EAE score = 1.9 +/− 0.2; 60% male in both genotypes; p-value from unpaired student t-test, data presented as mean +/− SEM). Source data are provided as a source data file. Figure 3a created in BioRender. Smith, M. (2025) https://BioRender.com/k30u268.
Fig. 4
Fig. 4. Proteomic and phosphoproteomic analysis of optic nerves at the peak of EAE to validate the effects of C3KO on mTORC1 signaling in the CNS.
a Volcano plot of all detected proteins in full proteomic analysis of N = 7 WT (mean score = 2) vs N = 7 C3KO (mean score = 1.8) EAE mouse optic nerves (each group consisted of mice from both sex). Both optic nerves from a mouse were needed to generate sufficient protein to constitute a biological replicate. To validate the findings of reduced ribosomal biogenesis in C3KO mice from our transcriptomic experiments (See supplemental Fig. S11) both small and large ribosomal proteins have been highlighted in red. b Ingenuity Pathway Analysis performed on the differentially abundant proteins from the proteomics experiment. Proteomics confirmed pathway-level decreases in mTOR signaling, glycolysis, mRNA translation, and antigen presentation in C3KO optic nerves, while C3KO mice upregulated energetically efficient processes like oxidative phosphorylation and the TCA cycle as well as reparative programs like the detoxification of reactive oxygen species. All pathways are significant by an adjusted p-value of <0.05. c Pre-ranked GSEA was run on the average relative log2 fold change in protein abundances between EAE C3KO vs WT mice. Proteins that were most upregulated in C3KO mice lie on the left of the ranked protein list, so a positive Normalized Enrichment Score (NES) indicates an upregulated pathway in C3KO mice (scores listed above each plot). d Individual analysis of the abundance of proteins that regulate mTORC1 signaling. Adjusted p-values are listed as numbers above the comparison bars. Note that TSC2 S939 refers to relative abundance of phosphorylation of TSC2 at serine 939, a post-translational modification that inhibits the TSC complex from acting as a GAP for Rheb. All other bar graphs indicate total protein abundance. Note that we compared the 7 WT and 7 C3KO EAE mice to 2 WT and 2 C3KO naïve mice optic nerve proteomes for controls. Data presented as mean +/- SEM, one-way ANOVA adjusted for multiple comparisons. e Diagram depicting results from proteomics and phosphoproteomics experiments on how C3 knockout affects mTORC1 regulation. Figure 4e created in BioRender. Smith, M. (2025) https://BioRender.com/d23a966.
Fig. 5
Fig. 5. Retinas are affected at peak EAE (day 16) and exhibit signs of synaptic pathology that are ameliorated by depletion of myeloid but not astrocytic C3.
a Diagram of experimental paradigm showing how eyes were either evaluated for synaptic pathology (left) via cross-sections or retinal ganglion cell (RGC) loss via flat mounts (right) on EAE d16 mice. b Representative image of flat-mounted retina with 12 regions selected for Brn3a+ RGC quantification. Scale bar in full retina image = 500 μm, in high magnification counting fields scale bar = 20 μm. c Quantification of Brn3a+ RGCs at peak EAE. N = 4 per experimental group. d Quantification of the integrated density of markers Syn1 (left) and PSD95 (right) in the inner plexiform layer of CFA vs GFAP-Cre animals at peak EAE. Signal intensity values are normalized to CFA control, with AU representing “arbitrary units”. N = 4 CFA, 10 GFAP-Cre and 7 GFAP-Cre+ mice. e Representative immunofluorescent staining of Syn1 (red) and PSD95 (green) in the inner and outer plexiform layers across GFAP-Cre experimental groups. Scale bar = 50 um. f Same as in e but evaluating synaptic markers in the inner plexiform layer of LysM-Cre+ and LysM-Cre mice. Values are normalized to the CFA only animals utilized in Fig. 5d. N = 4 CFA, 6 LysM-Cre and 8 LysM-Cre+ mice. g Representative immunofluorescent staining of Syn1 and PSD95 in LysM-Cre vs LysM-Cre+ mice. Scale bar = 50 um. All bar graphs presented as mean +/- SEM, with one-way ANOVAs adjusted for multiple comparisons. Source data are provided as a source data file. Figure 5a created in BioRender. Smith, M. (2025) https://BioRender.com/j21s335.
Fig. 6
Fig. 6. RGCs exhibit signs of myeloid C3-mediated neuronal injury both in the retina and in the optic nerve at peak EAE.
a Representative immunofluorescent staining of γH2AX (red) in the RGCs (γSyn – green) in the ganglion cell layer of retinas from CFA as well as MOG-injected GFAP-Cre+ and GFAP-Cre animals at peak EAE. Scale bar represents 20 μm. b Quantification of the percentage of RGCs that exhibit γH2AX staining. N = 4 CFA, 10 GFAP-Cre, and 7 GFAP-Cre+ mice. c As in (a) but for LysM-Cre+ and LysM-Cre animals. Scale bar represents 20 μm. d Quantification of c. N = 4 CFA, 6 LysM-Cre, and 8 LysM-Cre+ animals. CFA bar represents the same analysis as in 6b, as retinas were co-stained and analyzed simultaneously. e Representative immunofluorescent staining of 8-OHdG (red) in γSyn+ RGCs of CFA, LysM-Cre+, and LysM-Cre animals at peak EAE. Scale bar represents 20 μm. f Quantification of (e). N = 4 CFA, 6 LysM-Cre, and 9 LysM-Cre+ animals. g Representative immunofluorescent staining of SMI32+ axonal spheroids (red) in the optic nerves of CFA, LysM-Cre+, and LysM-Cre animals at peak EAE. Scale bar represents 100 μm (or 10 μm in high magnification inset). h Quantification of SMI32 density in optic nerves. N = 3 CFA, 5 LysM-Cre, and 6 LysM-Cre+ animals. Each dot represents mean values from 3 different regions along the length of each optic nerve. For all comparisons, data presented as mean +/- SEM, with one-way ANOVA adjusted for multiple comparisons. Source data are provided as a source data file.

Similar articles

Cited by

References

    1. Qian, K. et al. Revisiting the critical roles of reactive astrocytes in neurodegeneration. Mol. Psychiatry28, 2697–2706 (2023). - PubMed
    1. Hickman, S., Izzy, S., Sen, P., Morsett, L. & El Khoury, J. Microglia in neurodegeneration. Nat. Neurosci.21, 1359–1369 (2018). - PMC - PubMed
    1. Colonna, M. & Butovsky, O. Microglia function in the central nervous system during health and neurodegeneration. Annu Rev. Immunol.35, 441–468 (2017). - PMC - PubMed
    1. Liddelow, S. A. et al. Neurotoxic reactive astrocytes are induced by activated microglia. Nature541, 481–487 (2017). - PMC - PubMed
    1. Oechtering, J. et al. Complement activation is associated with disease severity in multiple sclerosis. Neurol. Neuroimmunol. Neuroinflamm.11, e200212 (2024). - PMC - PubMed

MeSH terms

LinkOut - more resources