Single cell transcriptome sequencing indicates the cellular heterogeneity of small intestine tissue in celiac disease
- PMID: 40216823
- PMCID: PMC11992159
- DOI: 10.1038/s41598-025-90300-z
Single cell transcriptome sequencing indicates the cellular heterogeneity of small intestine tissue in celiac disease
Abstract
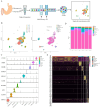
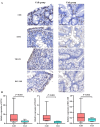
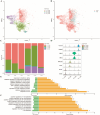
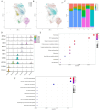
Celiac disease (CeD) is an autoimmune small intestinal disease caused by gluten protein ingestion by genetically susceptible individuals. Genome-wide association studies and transcriptomic data have limited capacity to capture intercellular genetic variations. We aimed to construct a single cell transcriptome spectrum, analyze the immune microenvironment and cellular heterogeneity, discover disease-related specific genes and markers, and explore the pathogenesis of CeD. This study performed single cell RNA sequencing (scRNA-seq) on three small intestine biopsies from patients with CeD and three matched healthy Chinese controls. Immunohistochemistry (IHC) and quantitative polymerase chain reaction (qPCR) were used to validate potential diagnostic biomarkers of disease-differential genes. A total of 10 cell subpopulations were annotated, including three types of epithelial and stromal cells and seven types of immune cells. IHC revealed a pronounced overexpression of T cell disease-differential genes, TRAT1, BCL11B, and ETS1 in intraepithelial lymphocytes in the CeD group. Further clinical validation using qPCR confirmed that ETS1 (P = 0.010), TRAT1 (P < 0.001), and BCL11B (P = 0.036) were enriched in the CeD small intestinal tissue. The CD28/CTLA-4 pathway regulates the homeostasis of Treg cells. The IFITs family genes may serve as marker genes for antiviral specific CD4+ T cell subsets. CeD-derived subsets of CD8+ T cells frequently express genes associated with cytotoxicity, including IFNG, GZMK, GZMH, GZMB, SH2D1A, PRF1, and NKG7, as well as genes related to T cell exhaustion, such as PDCD10, CTLA4, TIGIT, PDCD1, and DUSP4. Inflammation and infection pathways were enriched in different cell populations. A single cell expression profile of CeD small intestinal tissue was successfully constructed using scRNA-seq in this study. New biomarkers for CeD-specific histopathology and potential therapeutic targets were discovered, and the biomarkers observed between inflammation and infection pathways were closely related to the onset of CeD.
Keywords: Celiac disease; Immune microenvironment; Marker; Single cell RNA sequencing.
© 2025. The Author(s).
Conflict of interest statement
Declarations. Competing interests: The authors declare no competing interests. Ethics approval and consent to participate: The Written Informed consent were signed by all participants and ethical approval was obtained from the Ethics Committee of the People’s Hospital of Xinjiang Uyghur Autonomous Region (KY2021042011). Consent for publication: All authors have agreed to publish this manuscript.
Figures


Similar articles
-
Exploring the molecular mechanisms and shared gene signatures between celiac disease and ulcerative colitis based on bulk RNA and single-cell sequencing: Experimental verification.Int Immunopharmacol. 2024 May 30;133:112059. doi: 10.1016/j.intimp.2024.112059. Epub 2024 Apr 13. Int Immunopharmacol. 2024. PMID: 38615385
-
A Combined mRNA- and miRNA-Sequencing Approach Reveals miRNAs as Potential Regulators of the Small Intestinal Transcriptome in Celiac Disease.Int J Mol Sci. 2021 Oct 21;22(21):11382. doi: 10.3390/ijms222111382. Int J Mol Sci. 2021. PMID: 34768815 Free PMC article.
-
Single-Cell RNA Sequencing of Peripheral Blood Mononuclear Cells From Pediatric Coeliac Disease Patients Suggests Potential Pre-Seroconversion Markers.Front Immunol. 2022 Mar 15;13:843086. doi: 10.3389/fimmu.2022.843086. eCollection 2022. Front Immunol. 2022. PMID: 35371081 Free PMC article.
-
Molecular Biomarkers for Celiac Disease: Past, Present and Future.Int J Mol Sci. 2020 Nov 12;21(22):8528. doi: 10.3390/ijms21228528. Int J Mol Sci. 2020. PMID: 33198309 Free PMC article. Review.
-
A comprehensive review of the applications of RNA sequencing in celiac disease research.Gene. 2024 Nov 15;927:148681. doi: 10.1016/j.gene.2024.148681. Epub 2024 Jun 11. Gene. 2024. PMID: 38871036 Review.
References
-
- Catassi, C., Verdu, E. F., Bai, J. C. & Lionetti, E. Coeliac disease. Lancet399, 2413–2426. 10.1016/s0140-6736(22)00794-2 (2022). - PubMed
-
- Bai, J. C. & Ciacci, C. World gastroenterology organisation global guidelines: Celiac disease February 2017. J. Clin. Gastroenterol.51, 755–768. 10.1097/mcg.0000000000000919 (2017). - PubMed
-
- Singh, P. et al. Global prevalence of celiac disease: Systematic review and meta-analysis. Clin. Gastroenterol. Hepatol.16, 823–36e2. 10.1016/j.cgh.2017.06.037 (2018). - PubMed
-
- Kochhar, G. S., Singh, T., Gill, A. & Kirby, D. F. Celiac disease: Managing a multisystem disorder. Cleve Clin. J. Med.83, 217–227. 10.3949/ccjm.83a.14158 (2016). - PubMed
MeSH terms
Substances
Grants and funding
LinkOut - more resources
Full Text Sources
Medical
Research Materials
Miscellaneous

