

Remotely sensed data contribution in predicting the distribution of native Mediterranean species
- PMID: 40216846
- PMCID: PMC11992134
- DOI: 10.1038/s41598-025-94569-y
Remotely sensed data contribution in predicting the distribution of native Mediterranean species
Abstract
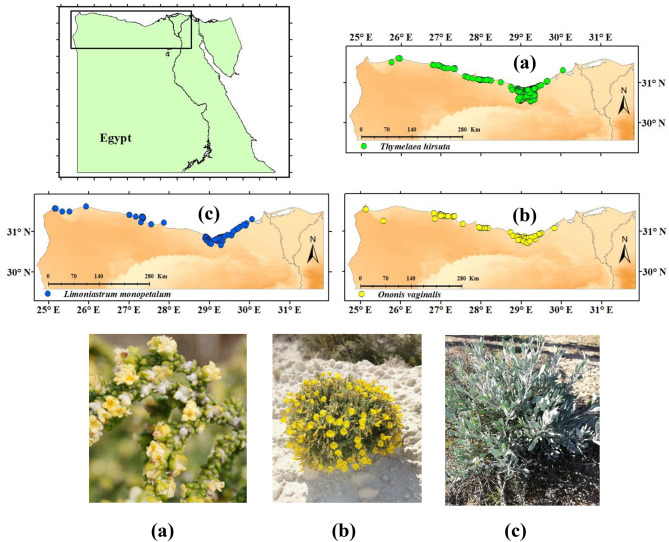
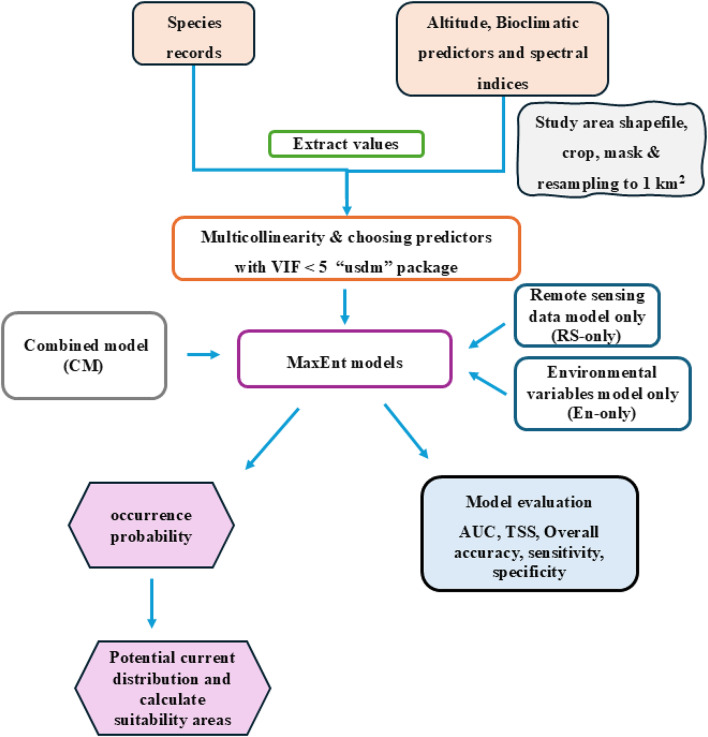
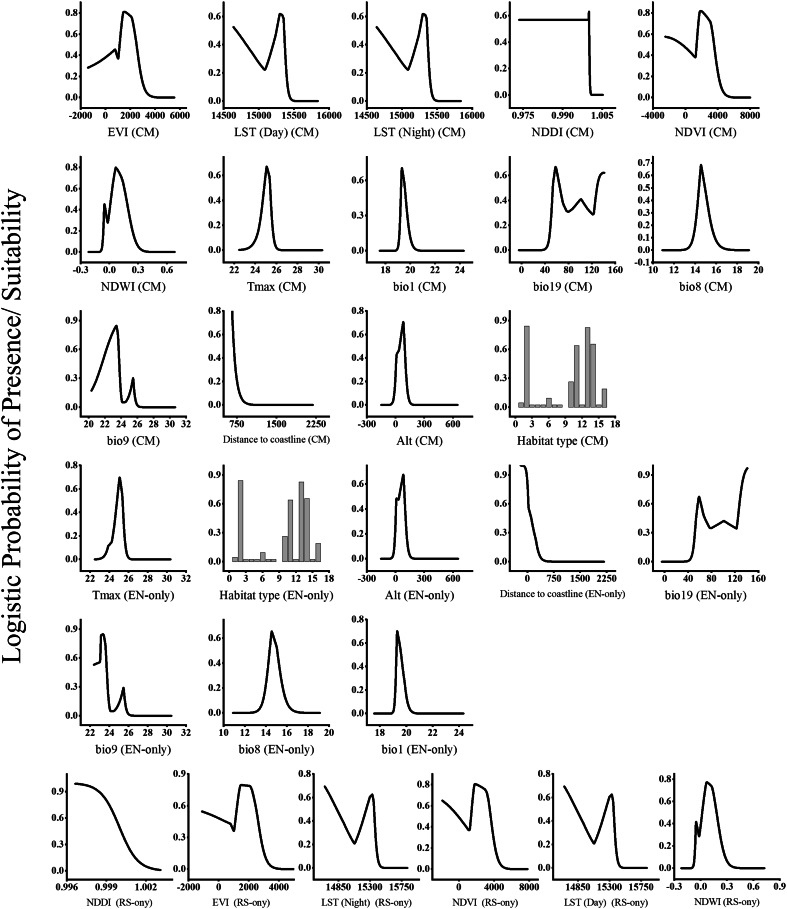
The global change threats significantly alters the ecological distribution of species across different ecosystems. Species distribution models (SDMs) are considered a widely used tool for assessing the global impact on biodiversity. Recently, remote sensing data have been used in a growing number of studies to predict species distribution and improve SDMs performance. This study evaluates the contribution of spectral indices in species distribution modeling using MaxEnt. We compared models based on spectral indices data (RS-only), environmental variables (EN-only), and their combination (CM) to predict the distribution of three key Mediterranean native species: Thymelaea hirsuta, Ononis vaginalis, and Limoniastrum monopetalum. The combined models (CM) demonstrated superior performance with excellent accuracy measures values compared to other models. Jackknife tests revealed both environmental factors (e.g., distance to coastline, mean temperature of wettest and driest quarters) and spectral indices (e.g., NDWI, LST) contributed substantially to predicting the studied species. The findings emphasize the importance of integrating diverse data sources to improve the accuracy of SDMs, particularly in heterogeneous landscapes like the Mediterranean region. This integrated approach provides a more comprehensive understanding of species spreading patterns and is critical for effective management and conservation strategies.
Keywords: Climate change; Conservation planning; Habitat characterization; MODIS data; Maxent; Species distribution modeling (SDM).
© 2025. The Author(s).
Conflict of interest statement
Declarations. Competing interests: The authors declare no competing interests. Compliance with ethical standards: This work was conducted according to the international and Egyptian legislation.
Figures


Similar articles
-
Predicting the future impact of climate change on the distribution of species in Egypt's mediterranean ecosystems.BMC Plant Biol. 2025 May 15;25(1):644. doi: 10.1186/s12870-025-06630-7. BMC Plant Biol. 2025. PMID: 40375130 Free PMC article.
-
Active remote sensing data and dispersal processes improve predictions for an invasive aquatic plant during a climatic extreme in Great Lakes coastal wetlands.J Environ Manage. 2024 Nov;370:122610. doi: 10.1016/j.jenvman.2024.122610. Epub 2024 Sep 27. J Environ Manage. 2024. PMID: 39340887
-
Contemporary Remotely Sensed Data Products Refine Invasive Plants Risk Mapping in Data Poor Regions.Front Plant Sci. 2017 May 15;8:770. doi: 10.3389/fpls.2017.00770. eCollection 2017. Front Plant Sci. 2017. PMID: 28555147 Free PMC article.
-
Application of species distribution models in predicting the distribution of marine macrobenthos.Ying Yong Sheng Tai Xue Bao. 2024 Sep 18;35(9):2392-2400. doi: 10.13287/j.1001-9332.202409.029. Ying Yong Sheng Tai Xue Bao. 2024. PMID: 39435802 Review. English.
-
[Application of species distribution models in the prediction of marine potential habitat: A review].Ying Yong Sheng Tai Xue Bao. 2017 Jun 18;28(6):2063-2072. doi: 10.13287/j.1001-9332.201706.006. Ying Yong Sheng Tai Xue Bao. 2017. PMID: 29745172 Review. Chinese.
Cited by
-
ALST-W integrated index for enhanced surface temperature mapping of water bodies and vegetation using Landsat 8/9 satellite bands.Sci Rep. 2025 Jul 9;15(1):24667. doi: 10.1038/s41598-025-09247-w. Sci Rep. 2025. PMID: 40634345 Free PMC article.
References
-
- Farahat, E. A., Galal, T. G., El-Midany, M. & Hassan, L. M. Effect of urban habitat heterogeneity on functional traits plasticity of the invasive species Calotropis procera (Aiton) W. T. Aiton. Rendiconti lincei. Scienze Fis. E Naturali26 (2), 193–201 (2015).
-
- Buckley, Y. M. & Puy, J. The macroecology of plant populations from local to global scales. New. Phytol. 233 (3), 1038–1050 (2022). - PubMed
-
- Zhong-hua, Z., Gang, H. & Jian, N. Effects of topographical and edaphic factors on the distribution of plant communities in two subtropical karst forests, Southwestern China. J. Mt. Sci.10 (2), 337–338 (2013).
-
- Zabin, C. J. et al. Increasing the resilience of ecological restoration to extreme climatic events. Front. Ecol. Environ.20 (5), 310–318 (2022).
MeSH terms
LinkOut - more resources
Full Text Sources
Research Materials
