

Malvidin-3-glucoside induces insulin secretion by activating the PLC/IP3 pathway and enhancing Ca2+ influx in INS-1 pancreatic β-cells
- PMID: 40216851
- PMCID: PMC11992297
- DOI: 10.1038/s41598-025-95808-y
Malvidin-3-glucoside induces insulin secretion by activating the PLC/IP3 pathway and enhancing Ca2+ influx in INS-1 pancreatic β-cells
Abstract
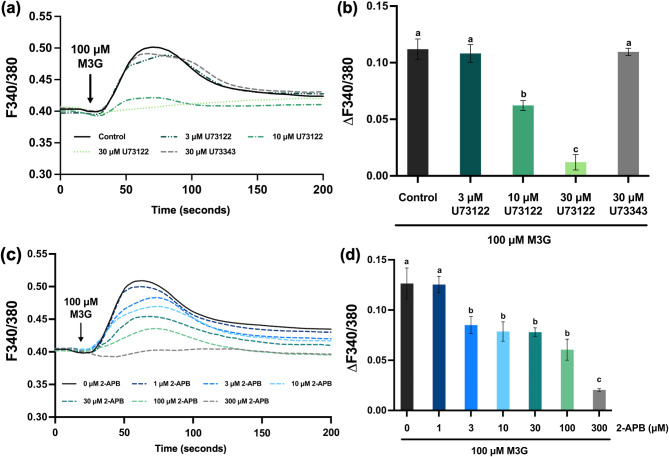
Malvidin-3-glucoside (M3G), an anthocyanin found in blueberries and grapes, shows promise as a natural anti-diabetic agent. However, its effect on insulin secretion and its underlying mechanisms remains unclear. This study investigated the impact of M3G on β-cells (INS-1) through real-time Ca2+ imaging and insulin secretion assays. M3G increased intracellular Ca2+ levels in a concentration-dependent manner, specifically targeting β-cells without affecting other pancreatic cell types. It enhanced insulin secretion under both basal (4 mM) and stimulatory (11 mM) glucose conditions while maintaining cell viability at concentrations up to 100 µM. Pharmacological inhibitors revealed that M3G-induced Ca2+ signals resulted from both Ca influx through L-type voltage-dependent calcium channels (L-type VDCCs) and Ca2+ release from the endoplasmic reticulum (ER) via the PLC/IP3 pathway. Nimodipine, an L-type VDCC blocker, inhibited M3G-induced Ca2+ influx, while U73122 (a PLC inhibitor) and 2-aminoethoxydiphenyl borate (2-APB), an IP3 receptor blocker, suppressed Ca2+ release from the ER. Additionally, M3G upregulated the expression of key glucose-stimulated insulin secretion (GSIS)-related genes, including Ins1 (insulin), Slc2a2 (GLUT2), and Gck (glucokinase). These findings suggest that M3G stimulates insulin secretion by promoting Ca2+ influx through L-type VDCCs, facilitating Ca2+ release from the ER, and upregulating GSIS-related genes. M3G holds promise as a natural anti-diabetic agent by enhancing insulin secretion and supporting β-cell function.
Keywords: Calcium signals; Insulin secretion; L-type voltage-dependent Ca2+ channels; Malvidin-3-glucoside; PLC/IP3; Pancreatic β-cells.
© 2025. The Author(s).
Conflict of interest statement
Declarations. Competing interests: The authors declare no competing interests.
Figures


Similar articles
-
Cyanidin-3-rutinoside stimulated insulin secretion through activation of L-type voltage-dependent Ca2+ channels and the PLC-IP3 pathway in pancreatic β-cells.Biomed Pharmacother. 2022 Feb;146:112494. doi: 10.1016/j.biopha.2021.112494. Epub 2021 Dec 7. Biomed Pharmacother. 2022. PMID: 34891116
-
Thiopental-induced insulin secretion via activation of IP3-sensitive calcium stores in rat pancreatic β-cells.Am J Physiol Cell Physiol. 2012 Mar 1;302(5):C796-803. doi: 10.1152/ajpcell.00081.2011. Epub 2011 Nov 30. Am J Physiol Cell Physiol. 2012. PMID: 22135216
-
G-protein coupled receptor 55 agonists increase insulin secretion through inositol trisphosphate-mediated calcium release in pancreatic β-cells.Eur J Pharmacol. 2019 Jul 5;854:372-379. doi: 10.1016/j.ejphar.2019.04.050. Epub 2019 May 1. Eur J Pharmacol. 2019. PMID: 31054273
-
β-Cell Ca(2+) dynamics and function are compromised in aging.Adv Biol Regul. 2015 Jan;57:112-9. doi: 10.1016/j.jbior.2014.09.005. Epub 2014 Sep 20. Adv Biol Regul. 2015. PMID: 25282681 Review.
-
Ca2+ release or Ca2+ entry, that is the question: what governs Ca2+ oscillations in pancreatic β cells?Am J Physiol Endocrinol Metab. 2023 Jun 1;324(6):E477-E487. doi: 10.1152/ajpendo.00030.2023. Epub 2023 Apr 19. Am J Physiol Endocrinol Metab. 2023. PMID: 37074988 Free PMC article. Review.
References
-
- Kojima, I., Medina, J. & Nakagawa, Y. Role of the glucose-sensing receptor in insulin secretion. Diabetes. Obes. Metab.19(Suppl 1), 54–62. 10.1111/dom.13013 (2017). - PubMed
-
- Khin, P. P., Lee, J. H. & Jun, H.-S. Pancreatic beta-cell dysfunction in type 2 diabetes. Eur. J. Inflamm.21, 17217X27231154152. 10.1177/1721727X231154152 (2023).
-
- Fu, J. et al. The impairment of glucose-stimulated insulin secretion in pancreatic β-cells caused by prolonged glucotoxicity and lipotoxicity is associated with elevated adaptive antioxidant response. Food. Chem. Toxicol.100, 161–167. 10.1016/j.fct.2016.12.016 (2017). - PubMed
-
- Robertson, R. P. Chronic oxidative stress as a central mechanism for glucose toxicity in pancreatic islet beta cells in diabetes. J. Biol. Chem.279, 42351–42354. 10.1074/jbc.R400019200 (2004). - PubMed
-
- Rolo, A. P. & Palmeira, C. M. Diabetes and mitochondrial function: Role of hyperglycemia and oxidative stress. Toxicol. Appl. Pharmacol.212, 167–178. 10.1016/j.taap.2006.01.003 (2006). - PubMed
MeSH terms
Substances
Grants and funding
LinkOut - more resources
Full Text Sources
Medical
Miscellaneous
