

Leveraging explainable AI to predict soil respiration sensitivity and its drivers for climate change mitigation
- PMID: 40216855
- PMCID: PMC11992127
- DOI: 10.1038/s41598-025-96216-y
Leveraging explainable AI to predict soil respiration sensitivity and its drivers for climate change mitigation
Abstract
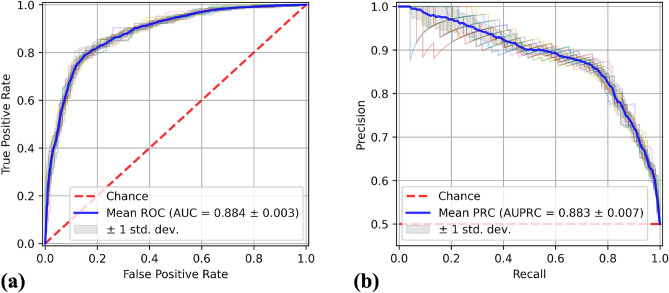
Global warming is one of the most pressing and critical problems facing the world today. It is mainly caused by the increase in greenhouse gases in the atmosphere, such as carbon dioxide (CO2). Understanding how soils respond to rising temperatures is critical for predicting carbon release and informing climate mitigation strategies. Q10, a measure of soil microbial respiration, quantifies the increase in CO2 release caused by a [Formula: see text] Celsius rise in temperature, serving as a key indicator of this sensitivity. However, predicting Q10 across diverse soil types remains a challenge, especially when considering the complex interactions between biochemical, microbiome, and environmental factors. In this study, we applied explainable artificial intelligence (XAI) to machine learning models to predict soil respiration sensitivity (Q10) and uncover the key factors driving this process. Using SHAP (SHapley Additive exPlanations) values, we identified glucose-induced soil respiration and the proportion of bacteria positively associated with Q10 as the most influential predictors. Our machine learning models achieved an accuracy of [Formula: see text], precision of [Formula: see text], an AUC-ROC of [Formula: see text], and an AUC-PRC of [Formula: see text], ensuring robust and reliable predictions. By leveraging t-SNE (t-distributed Stochastic Neighbor Embedding) and clustering techniques, we further segmented low Q10 soils into distinct subgroups, identifying soils with a higher probability of transitioning to high Q10 states. Our findings not only highlight the potential of XAI in making model predictions transparent and interpretable, but also provide actionable insights into managing soil carbon release in response to climate change. This research bridges the gap between AI-driven environmental modeling and practical applications in agriculture, offering new directions for targeted soil management and climate resilience strategies.
Keywords: Climate Change; Explainable Artificial Intelligence (XAI); Machine Learning; Q10; Soil Respiration Sensitivity.
© 2025. The Author(s).
Conflict of interest statement
Declarations. Competing interests: The authors declare no competing interests.
Figures


References
-
- Allen, D. E., Singh, B. P. & Dalal, R. C. Soil health indicators under climate change: a review of current knowledge. Soil health and climate change 25–45, 10.1007/978-3-642-20256-8_2 (2011).
-
- Lal, R. Soil health and climate change: an overview. Soil health and climate change 3–24, 10.1007/978-3-642-20256-8_1 (2011).
-
- Patil, A. & Lamnganbi, M. Impact of climate change on soil health: A review. Int. J. Chem. Stud.6, 2399–2404 (2018).
-
- Meyer, N., Meyer, H., Welp, G. & Amelung, W. Soil respiration and its temperature sensitivity (q10): Rapid acquisition using mid-infrared spectroscopy. Geoderma323, 31–40. 10.1016/j.geoderma.2018.02.031 (2018).
MeSH terms
Substances
LinkOut - more resources
Full Text Sources
Medical
Miscellaneous
