. 2025 Apr 11;15(1):12388.
doi: 10.1038/s41598-025-97078-0.

In silico pan-cancer analysis of VRAC subunits and their prognostic roles in human cancers

Affiliations

In silico pan-cancer analysis of VRAC subunits and their prognostic roles in human cancers

Alessandro Paolì et al. Sci Rep. .

Abstract

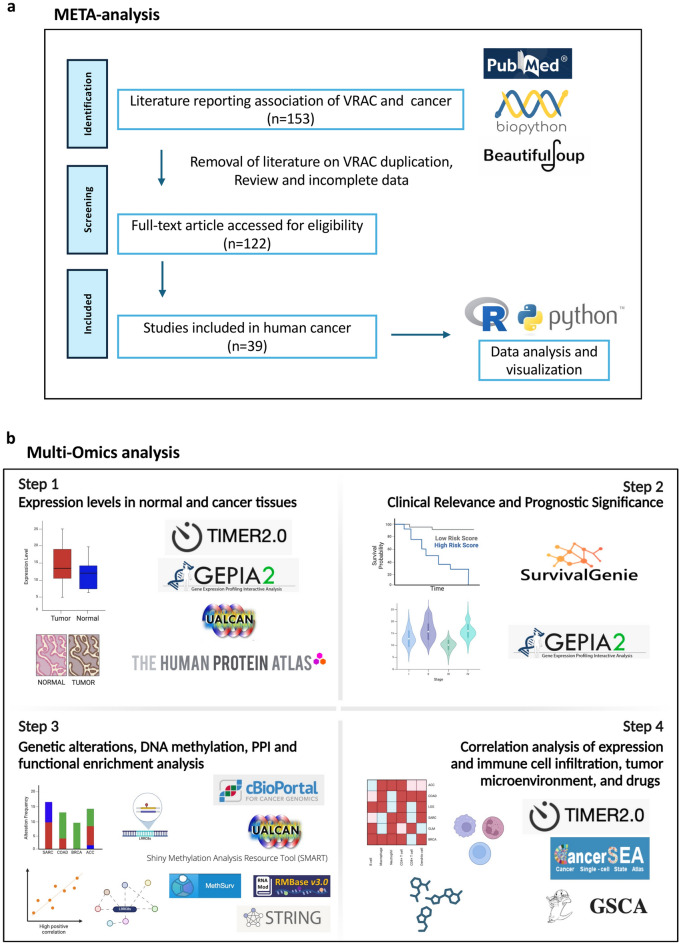
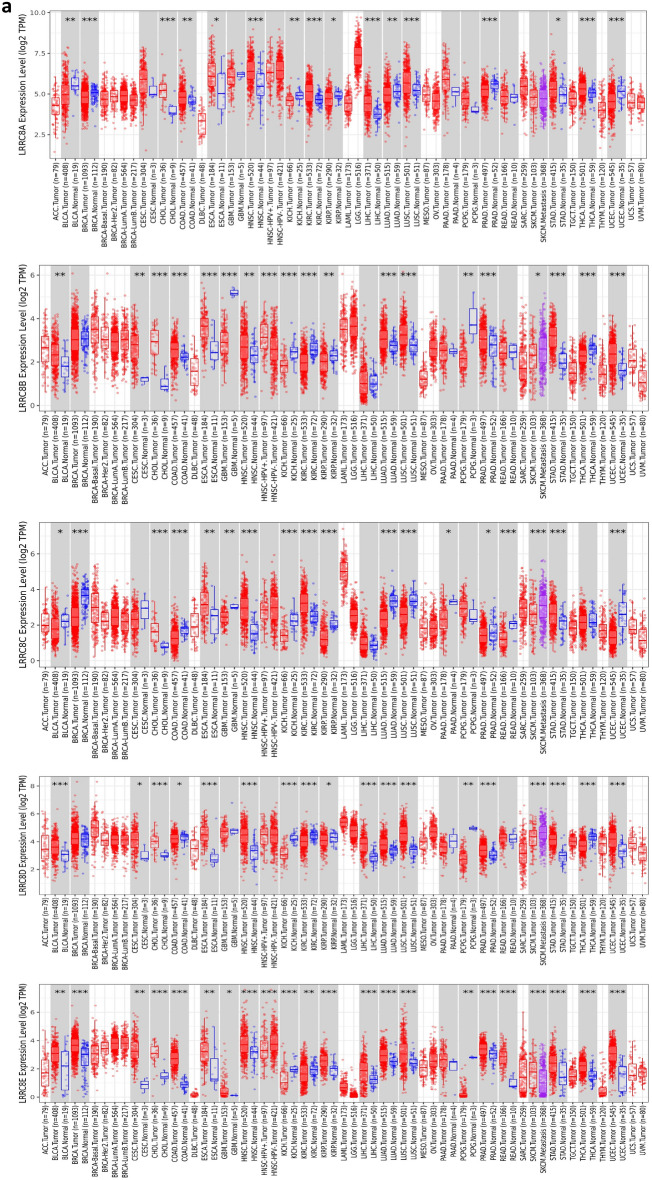
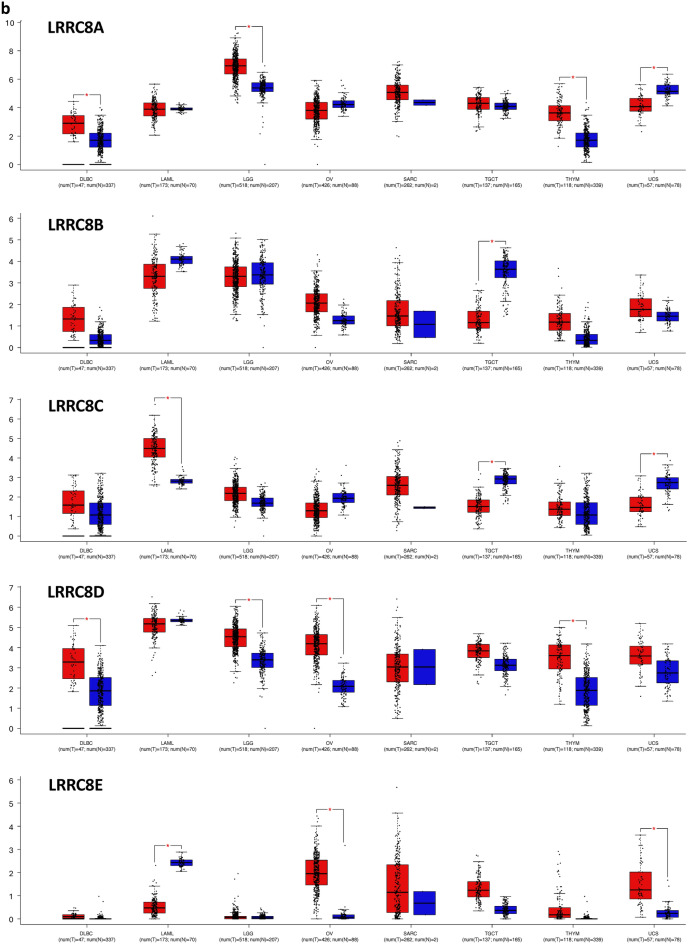
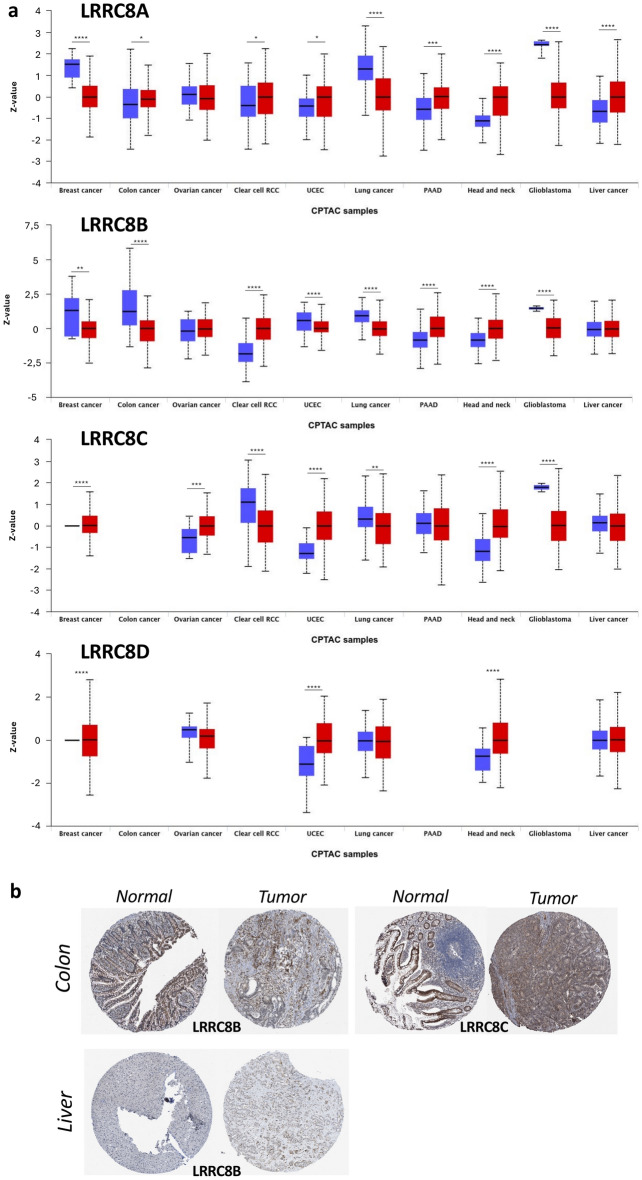
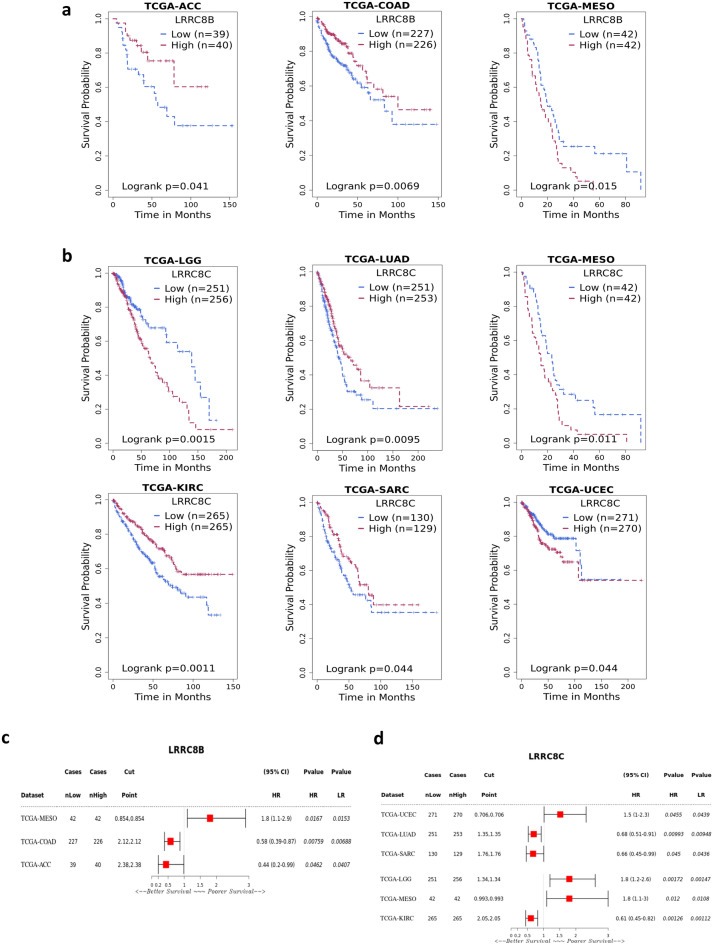
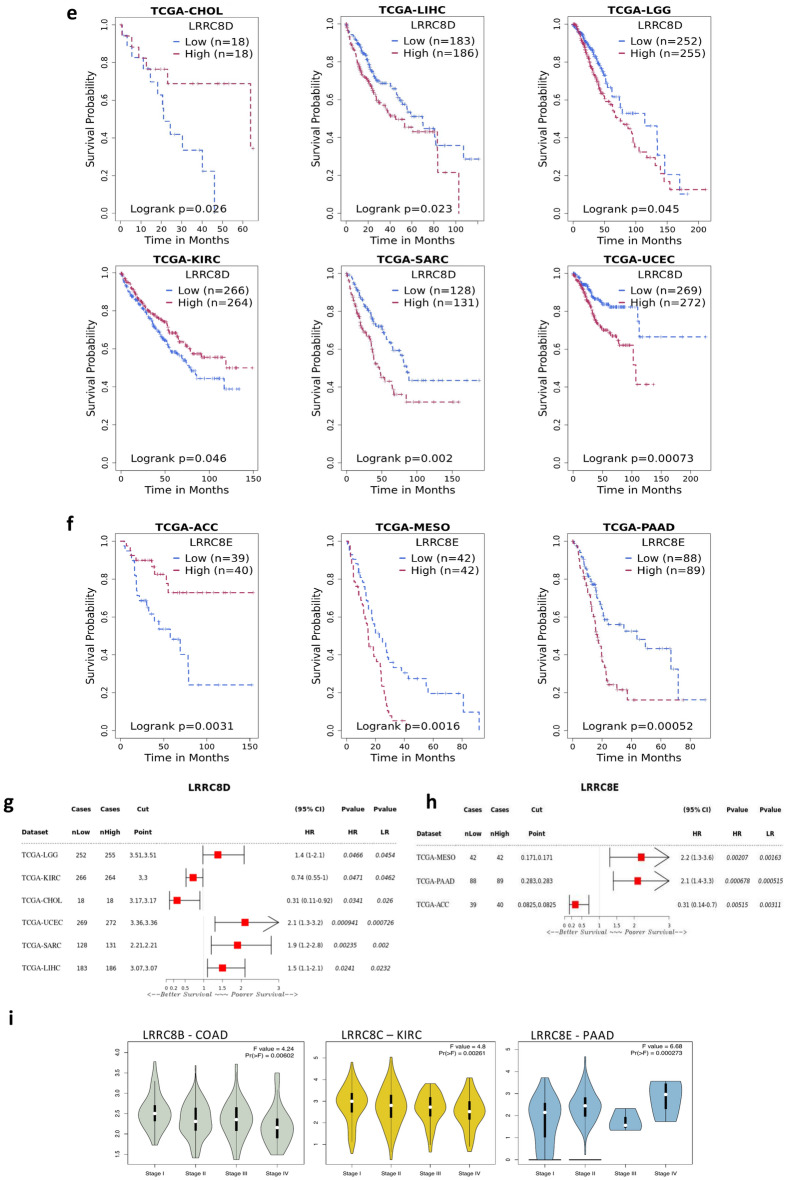
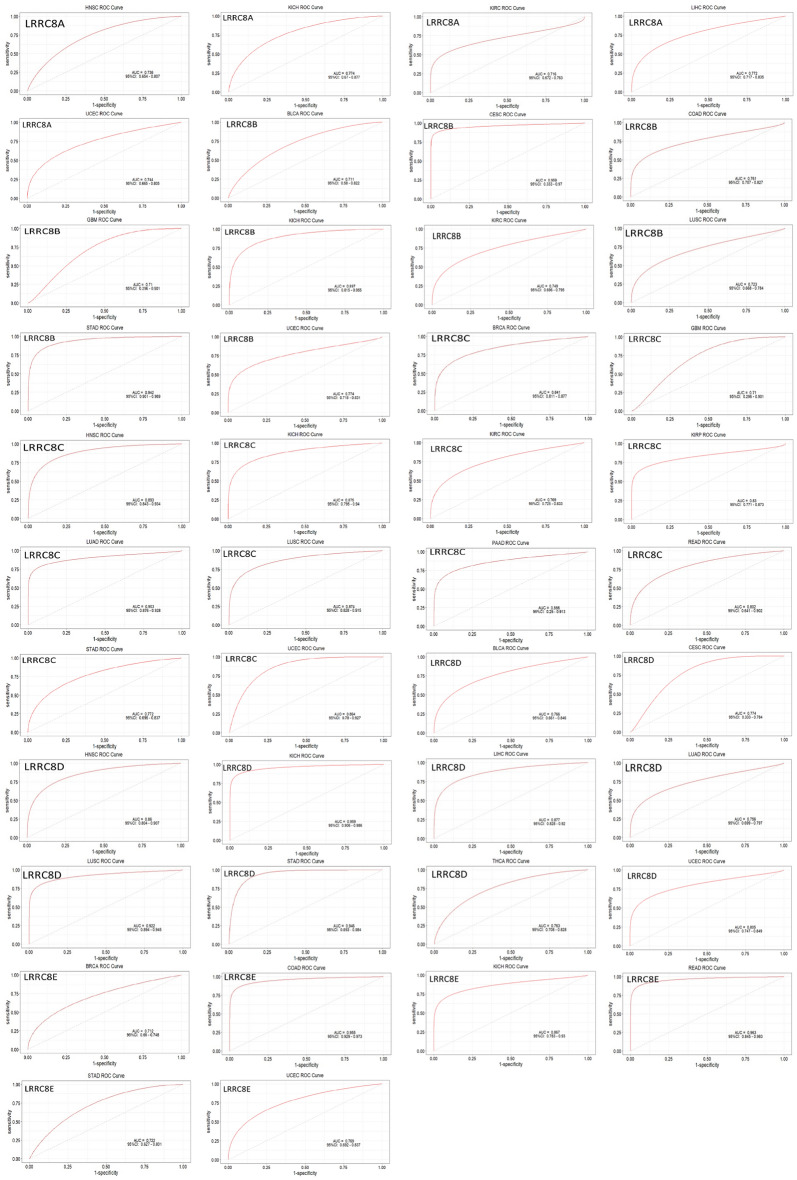
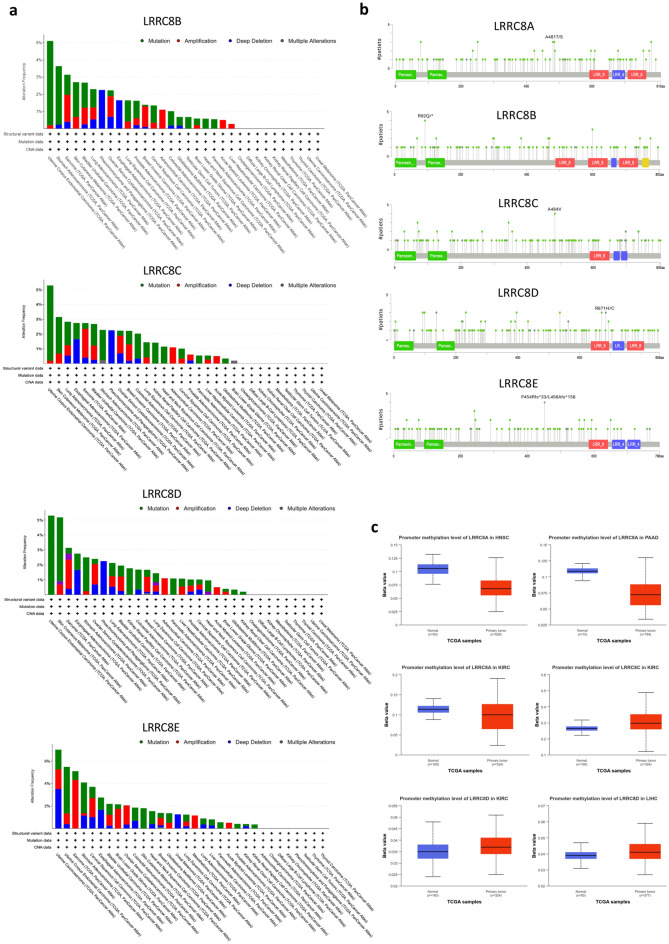
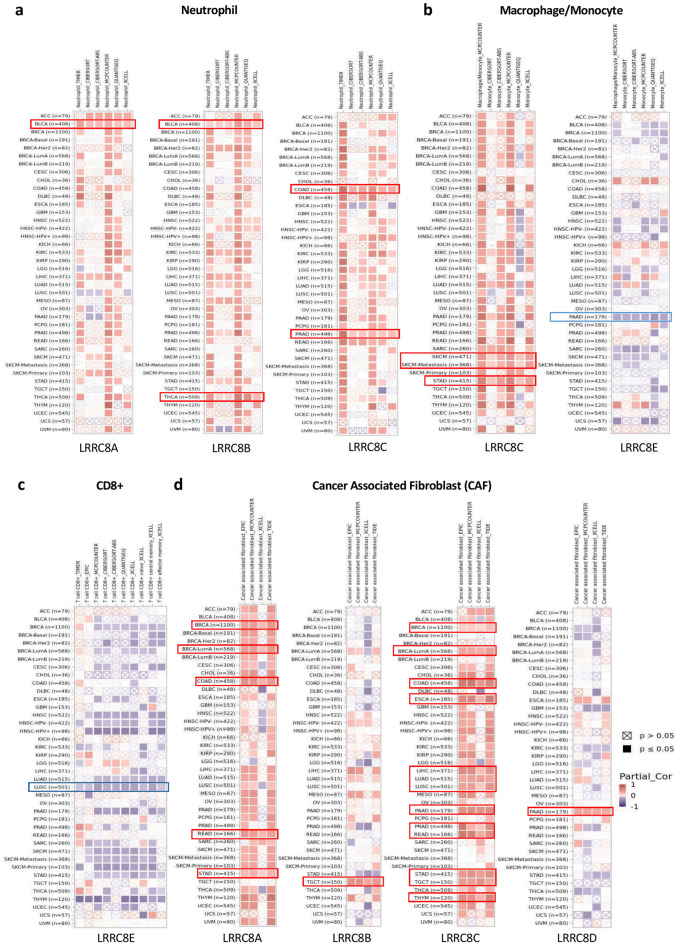
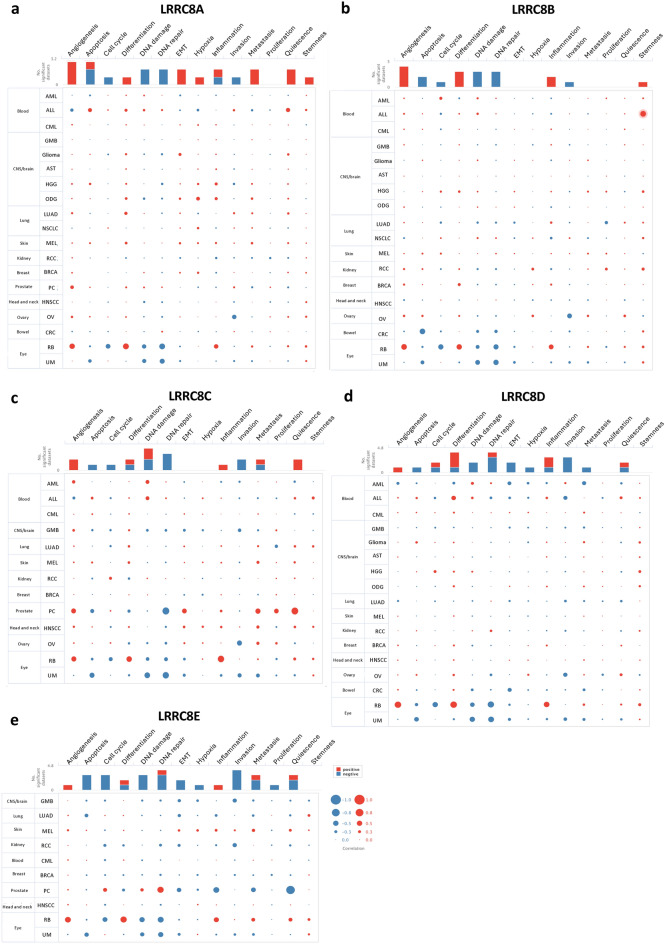
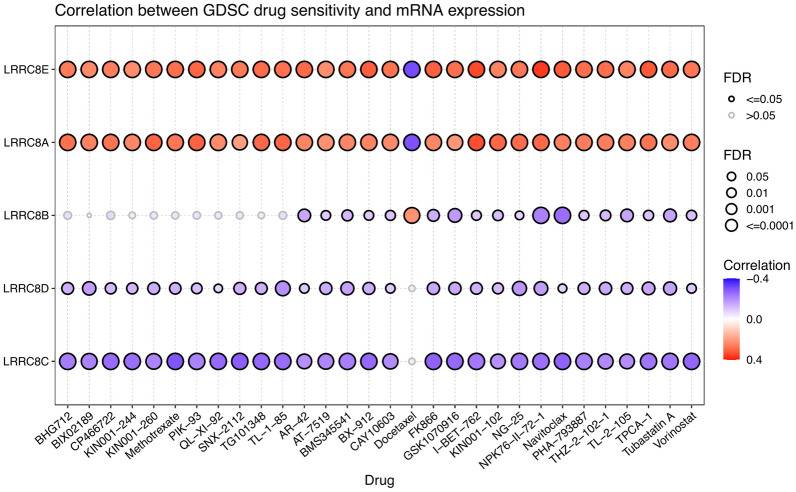
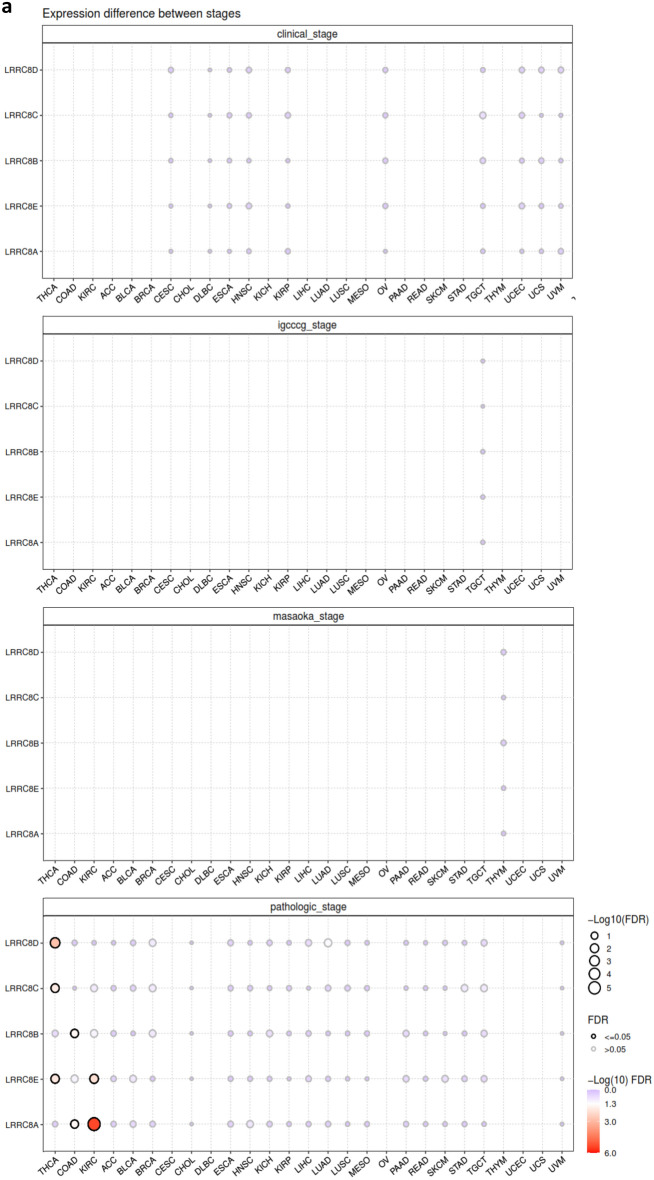
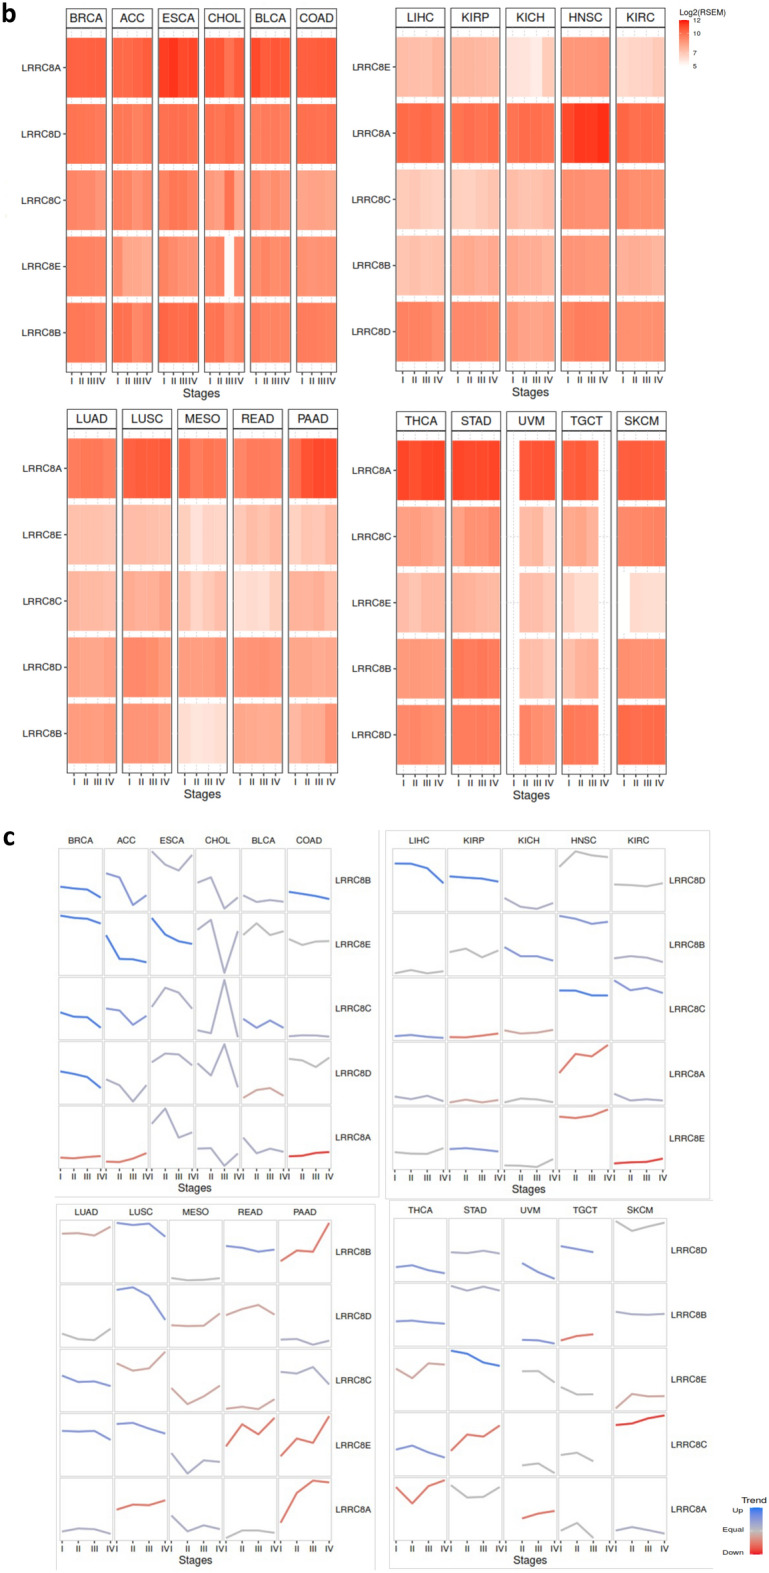
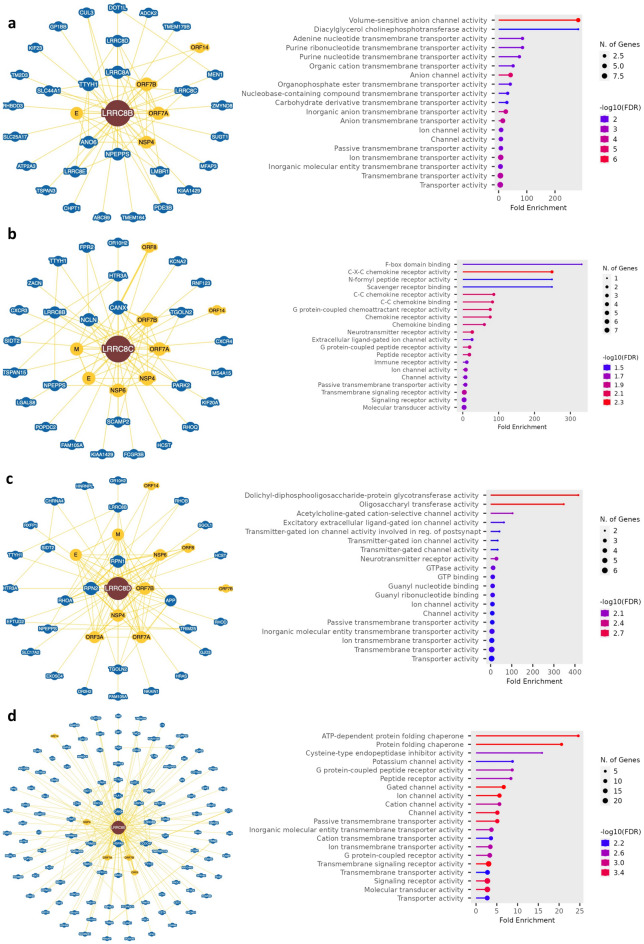
The study focuses on the VRAC channel and its significant roles in cancer development. It addresses a research gap by conducting a pan-cancer analysis with multi-omics bioinformatics tools, integrating data from the Human Protein Atlas (HPA) and Genotype-Tissue Expression (GTEx) datasets to examine mRNA expression patterns of its Leucine Rich Repeat Containing 8 (LRRC8) subunits in various tissues and cancers. The study links variations in LRRC8s expression with patient outcomes and includes analyses of DNA and RNA methylation. The study reveals significant correlations between LRRC8s expression and immune cell infiltration, as well as a positive association with cancer-associated fibroblasts and key immune regulators such as major histocompatibility complex (MHCs) and chemokines. Furthermore, the research suggests that LRRC8s are involved in cancer-signalling pathways, which may offer new therapeutic targets. Additionally, a drug sensitivity analysis shows that LRRC8 subunits affect drug responses differently, supporting the use of personalized therapeutic strategies. In conclusion, the study emphasizes the significance of VRAC subunits in cancer biology and suggests their potential as biomarkers and targets in cancer immunotherapy and personalized medicine.

Keywords: Immuno-oncology; LRRC8 subunits; Prognosis; VRAC.


Conflict of interest statement

Declarations. Competing interests: The authors declare no competing interests.

Figures

Fig. 1
Fig. 1
The schematic pipeline for this study. (a) META-analysis. (b) Multi-omics analysis.
Fig. 2
Fig. 2
Illustration of the expression patterns of LRRC8s across various cancer types. (a) TIMER2.0 analysis shows LRRC8s expression levels in TCGA cancers compared to normal tissues, with significance denoted as ***p < 0.001; **p < 0.01; *p < 0.05. (b) GEPIA2.0 analysis showcases LRRC8s expression in tumor versus normal tissues.
Fig. 2
Fig. 2
Illustration of the expression patterns of LRRC8s across various cancer types. (a) TIMER2.0 analysis shows LRRC8s expression levels in TCGA cancers compared to normal tissues, with significance denoted as ***p < 0.001; **p < 0.01; *p < 0.05. (b) GEPIA2.0 analysis showcases LRRC8s expression in tumor versus normal tissues.
Fig. 3
Fig. 3
UALCAN and HPA analyses reveal upregulated expression of LRRC8B and LRRC8C in tumor tissues. (a) UALCAN analysis results provide insights into LRRC8s expression. (b) LRRC8B expression is upregulated in numerous tumor tissues, including colon and liver. Similarly, LRRC8C showed increased expression in colon samples compared to normal samples, a finding supported by HPA. IHC results are provided by the HPA dataset.
Fig. 4
Fig. 4
Association of LRRC8s expression with patient prognosis across various cancer types. (ah) Kaplan–Meier survival curves illustrating overall survival (OS) disparities between high and low LRRC8s expression levels in various cancer types. A forest plot presenting the results of multivariate regression analysis for LRRC8s in tumors as detailed in Figs. A–D. (i) Exploration of the correlation between mRNA expression levels of specific LRRC8s family members and individual cancer stages among patients with COAD, KIRC, and PAAD, utilizing GEPIA.
Fig. 4
Fig. 4
Association of LRRC8s expression with patient prognosis across various cancer types. (ah) Kaplan–Meier survival curves illustrating overall survival (OS) disparities between high and low LRRC8s expression levels in various cancer types. A forest plot presenting the results of multivariate regression analysis for LRRC8s in tumors as detailed in Figs. A–D. (i) Exploration of the correlation between mRNA expression levels of specific LRRC8s family members and individual cancer stages among patients with COAD, KIRC, and PAAD, utilizing GEPIA.
Fig. 5
Fig. 5
ROC curves for various TCGA cancer types. ROC curves for several cancer types within the TCGA database. The curves demonstrate the performance of different models, with the AUC scores indicating the diagnostic ability of the models to distinguish between the presence and absence of the specific cancer type based on genomic data. AUC values > 0.7.
Fig. 6
Fig. 6
Mutation and methylation analyses conducted for LRRC8s across diverse tumors sourced from TCGA, using both the cBioPortal and UALCAN tools. (a, b) The analysis conducted using cBioPortal revealed the mutation type, frequency, and sites of LRRC8s across various cancer types. (c) The UALCAN tool was used to examine beta values, which indicate the promoter methylation level among different LRRC8s family members in specific carcinomas, and to compare normal and tumor tissues.
Fig. 7
Fig. 7
The interplay between immune cell dynamics and LRRC8 genes expression in TCGA cancer profiles. Correlation between the expression of LRRC8 gene family members and the presence of different immune cell types (neutrophils (a), macrophages/monocytes (b), T cells CD8+ (c), and cancer-associated fibroblasts (d)) in multiple cancer datasets from TCGA is presented. Each cell in the heatmap represents the partial correlation coefficient between gene expression and immune cell abundance. The color intensity indicates the strength and direction of the correlation, with red representing a positive correlation and blue representing a negative correlation. The color saturation represents the statistical significance of the correlation.
Fig. 8
Fig. 8
The function of VRAC subunits in single-cell functional analysis from the CancerSEA database. Functional status in different human cancers of (a) LRRC8A. (b) LRRC8B. (c) LRRC8C. (d) LRRC8D. (e) LRRC8E.
Fig. 9
Fig. 9
The associations of LRRC8s expression and drug sensitivity based on GSCA.
Fig. 10
Fig. 10
Expression variability of LRRC8 genes and their association with clinicopathologic features. (a) Expression difference between clinical stage in the pathological stage. (b) expression tendency in pathogenic stage (heatmap). (c) expression tendency in pathogenic stage (trend plot).
Fig. 10
Fig. 10
Expression variability of LRRC8 genes and their association with clinicopathologic features. (a) Expression difference between clinical stage in the pathological stage. (b) expression tendency in pathogenic stage (heatmap). (c) expression tendency in pathogenic stage (trend plot).
Fig. 11
Fig. 11
Comprehensive functional mapping of LRRC8 protein interactions and activities using BioGRID and ShinyGO 0.80 analyses. (a) The interaction network of LRRC8B highlights its role in various protein transport activities, with particular emphasis on the regulation of volume-sensitive anion channels and the transport of nucleobase-containing compounds. (b) The network of LRRC8C highlights its involvement in receptor-mediated processes, with an enriched presence of G protein-coupled receptors and those integral to immune responses and chemotactic signalling. (c) The network of LRRC8D showing its involvement in neurotransmitter-gated ion channels, along with related enzymatic activities, including dolichyl-diphosphooligosaccharide protein glycotransferase and GTPase. (d) The network associated with LRRC8E shows its connectivity within protein folding mechanisms and ion channel regulation, with a central node representing protein folding chaperones and their associated cation and gated channels.

Similar articles

References

    1. Feinberg, A. P. & Levchenko, A. Epigenetics as a mediator of plasticity in cancer. Science379(6632), eaaw3835 (2023). - PMC - PubMed
    1. Orsolic, I., Carrier, A. & Esteller, M. Genetic and epigenetic defects of the RNA modification machinery in cancer. Trends Genet.39(1), 74–88 (2023). - PubMed
    1. Ilango, S. et al. Epigenetic alterations in cancer. Front. Biosci. (Landmark Ed.)25(6), 1058–1109 (2020). - PubMed
    1. Gu, Y. et al. Molecular mechanisms and therapeutic strategies in overcoming chemotherapy resistance in cancer. Mol. Biomed.6(1), 2 (2025). - PMC - PubMed
    1. Yu, B., Shao, S. & Ma, W. Frontiers in pancreatic cancer on biomarkers, microenvironment, and immunotherapy. Cancer Lett.610, 217350 (2025). - PubMed