. 2025 Apr 11;15(1):12497.
doi: 10.1038/s41598-025-96576-5.

Development and validation of a novel endoplasmic reticulum stress-related lncRNA signature in laryngeal squamous cell carcinoma

Affiliations

Development and validation of a novel endoplasmic reticulum stress-related lncRNA signature in laryngeal squamous cell carcinoma

Xiazhi Pan et al. Sci Rep. .

Abstract

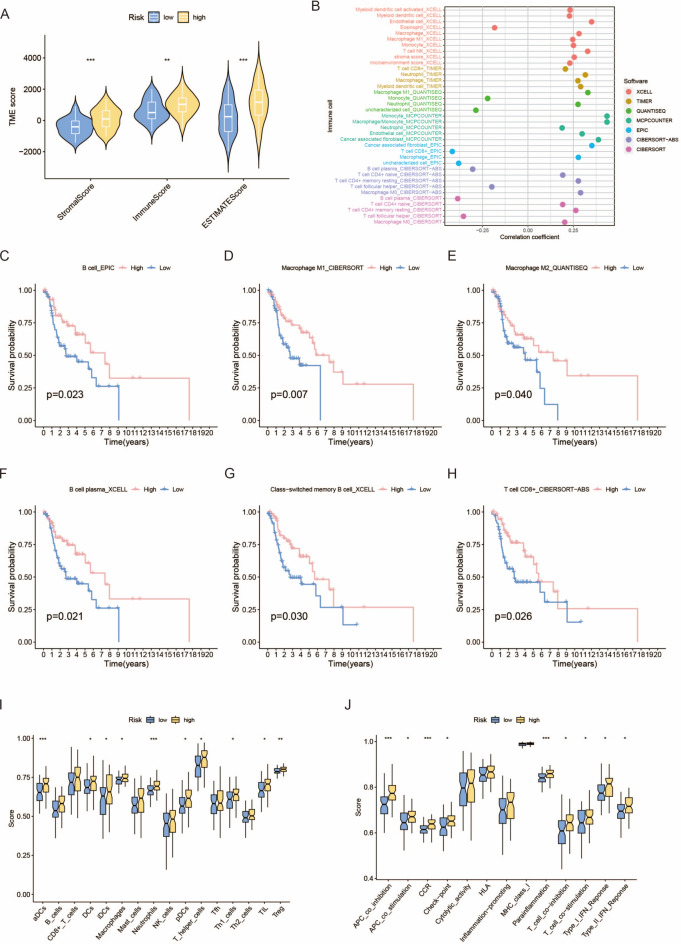
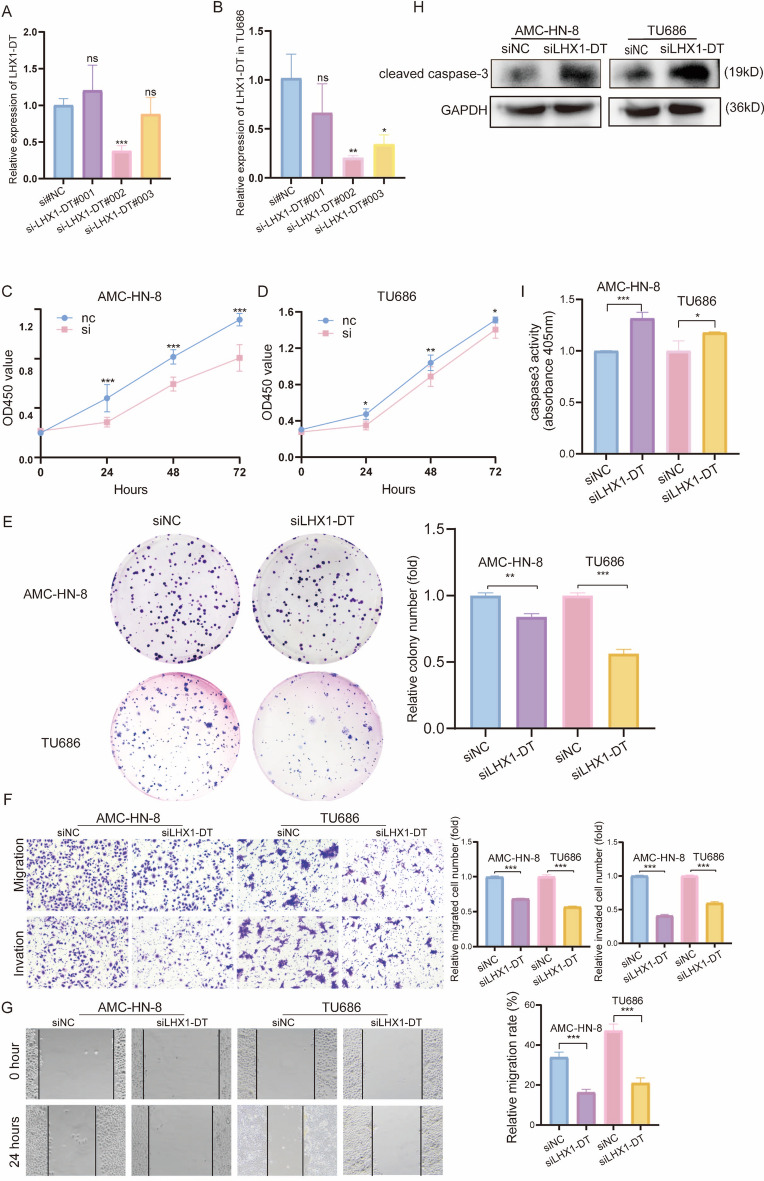
Endoplasmic reticulum stress (ERS) is an intracellular process in which improperly folded proteins lead to a cellular stress response. How endoplasmic reticulum stress contributes to the onset and progression of laryngeal squamous cell carcinoma remains unclear. Our research aimed to find an ERS signature to forecast the prognosis of laryngeal squamous cell carcinoma and to investigate its potential biological functions. LSCC sample data obtained from The Cancer Genome Atlas (TCGA) database were co-expressed with ERS- related genes, and then a prognostic signature on the basis of endoplasmic reticulum stress- related lncRNAs (ERS-related lncRNAs) was constructed by differential analysis and Cox regression analysis. Survival analysis, TMB, consensus cluster analysis, drug sensitivity analysis, immune analysis and clinical drug prediction were carried out on the model. Finally, the function of LHX1-DT was verified by in vitro experiments. From the TCGA-LSCC cohort, 35 significantly different ERS-related lncRNAs were identified. A prognostic signature consisting of three lncRNAs (AC110611.2, LHX1-DT, and AL157373.2) was identified. Kaplan-Meier analysis demonstrated the predictive ability of the model for overall survival. Calibration curves and receiver operating characteristic curves were validated and showed high predictive accuracy. Ultimately, the experimental results verified the expression of LHX1-DT in LSCC.

Keywords: Endoplasmic reticulum stress; Laryngeal squamous cell carcinoma; LncRNA; Prognostic model.


Conflict of interest statement

Declarations. Competing interests: The authors declare no competing interests.

Figures

Fig. 1
Fig. 1
Flow chart of data collection and analysis.
Fig. 2
Fig. 2
Identification of ERS-related lncRNAs in LSCC patients. (A) The heatmap reflecting expression levels of ERS-related lncRNAs; (B) The volcano map showing the expression levels of ERS-related lncRNAs.
Fig. 3
Fig. 3
Construction of an ERS-related lncRNA Prognostic signature and analysis of independent prognostic potentials. (A) The forest plot showing the results of univariate Cox regression analysis of 35 prognostic ERS-related lncRNAs; (B) The heatmap showing the expression levels of these 35 genes in LSCC and normal tissues; (C) Cross-validation in LASSO regression to optimize parameter selection; (D) LASSO coefficient profile; (EH) PCA illustrates that the model lncRNA group (H) is most effective in differentiating patients in high and low risk groups than ERS-related lncRNAs (E), ERS-related genes (F) and all genes (G); (I-J) Univariate and multivariate analysis assessing relationship between risk scores and relevant clinical parameters and OS in the TCGA–LSCC cohort; (K) The Nomogram model of the risk score and clinical indicators for predicting 1-year, 3-year, and 5-year OS of LSCC patients; (L) Calibration curves of the nomogram prediction of OS of patients in TCGA-LSCC cohort.
Fig. 4
Fig. 4
Establishment and verification of the prognostic signature of the ERS-related lncRNA signature in the training, validation and complete sets. (A-C) Kaplan–Meier survival curves of LSCC patients’ OS in the high-risk and low-risk groups in the training (A), validation (B), and complete sets (C); (D-F) Risk score distribution in the high-risk and low-risk groups in the training (D), validation (E), and complete sets (F); (GI) Scatter plots of LSCC patient survival status distribution in the training (G), validation (H), and complete sets (I); (JL) Risk heatmaps of the 3 ERS-related lncRNA expression in the training (J), validation (K), and complete sets (L); (MO) ROC curves of the prognostic ERS-related lncRNAs signature at 1-, 2-, and 3-year in the training (M), validation (N) and complete sets (O); (P-R) AUC of ROC curves comparing the prognostic accuracy of the risk score and other prognostic factors in the training (P), validation (Q) and complete sets (R).
Fig. 5
Fig. 5
Biological functional and pathway enrichment analysis of ERS-related lncRNA Signature. (A-C) The GO function enrichment analysis; (D-E) The GSEA pathway enrichment analysis in high-risk and low-risk groups.
Fig. 6
Fig. 6
The relationship between TMB and ERS-related lncRNA signature. (A-B) The oncoplots show the top 15 gene with the highest mutation rate in the high-risk group (A) and low-risk group (B); (C)TMB differences between high-risk and low-risk groups; (D) Relationship between TMB and risk scores; (E) Kaplan–Meier survival analysis of LSCC patients between the High-TMB and Low-TMB patients; (F) Kaplan–Meier survival curves of LSCC patients across High-TMB + high risk, High-TMB + low risk, Low-TMB + high risk, and Low-TMB + low risk. TMB, tumor mutational burden.
Fig. 7
Fig. 7
Analysis of tumor immune signature. (A) The boxplot for StromalScore, ImmuneScore, and ESTIMATEScore in the high- and low-risk groups; (B) Estimation of immune-infiltrating cells in LSCC by using different algorithms; (C-H) Kaplan–Meier survival curves of screened B cells (C), Macrophages M1 (D), Macrophages M2 (E) , plasma cells (F), B memory cells (G) and CD8 + T cells (H) in LSCC patients; (I-J) The score of the infiltrating immune cells (I) and immune-related functions (J) in the high-risk and low-risk groups.
Fig. 8
Fig. 8
Identification of ERS-related lncRNA Signature through consensus cluster. (A) Consensus clustering CDF for k = 2 to 9; (B) The consensus score matrix of all samples when k = 3; (C) Length and slope of the CDF curve as the index changes from 2 to 9; (D) Kaplan–Meier survival curves of LSCC patients’OS among the three different clusters; (E) Sankey diagram of the relationship between three different subgroups and risk scores; (F) tSNE analysis between three different subgroups; (G) tSNE analysis between high- and low-risk groups; (H) Heatmap reflects differences in immune cell infiltration between the three clusters; (I) Boxplot showing the expression of immune checkpoint molecules between the three clusters.
Fig. 9
Fig. 9
Potential drug sensitivity analysis by IC50 and the immune checkpoint gene expression analysis between the high-risk and low-risk groups. (A) Boxplots showing the drug sensitivity analysis of commonly used chemotherapeutic agents in LSCC between high-risk and low-risk groups; (B) Violin showing expression of TIDE score between the high-risk and low-risk groups.
Fig. 10
Fig. 10
LHX1-DT expression is up-regulated in LSCC. (A-F) Expression difference analysis and Kaplan–Meier survival analysis of AC110611.2, LHX1-DT and AL157373.2;(G-H) RT-qPCR detected the expression of LHX1-DT in normal and tumor tissues. *P < 0.05, **P < 0.01 and ***P < 0.001.
Fig. 11
Fig. 11
LHX1-DT regulates the malignancy of LSCC. (A-B) Detection of relative silencing levels of LHX1-DT in AMC-HN-8 (A) and TU686 (B); (C-D) Knockdown of LHX1-DT in AMC-HN-8 (C) and TU686 (D) cells by CCK8 analysis; (EG) Knockdown of LHX1-DT in AMC-HN-8 and TU686 cells by colony formation assay (E), transwell assay (F), Wound healing assay (G); (H) Western blotting was performed to detect protein levels of the apoptosis marker cleaved caspase 3 in knockdown of LHX1-DT in AMC-HN-8 and TU686 cells; (I) Caspase3 activity was measured in AMC-HN-8 and TU686. *P < 0.05, **P < 0.01 and ***P < 0.001.

Similar articles

References

    1. Zhang, X. et al. Research progress on the interaction between oxidative stress and platelets: Another avenue for cancer?. Pharmacol. Res.191, 106777 (2023). - PubMed
    1. Hu, C. et al. Oleanolic Acid Induces Autophagy and Apoptosis via the AMPK-mTOR Signaling Pathway in Colon Cancer. J. Oncol.2021, 8281718 (2021). - PMC - PubMed
    1. Li, S. et al. Exosomes: Another intercellular lipometabolic communication mediators in digestive system neoplasms?. Cytokine Growth Factor Rev.73, 93–100 (2023). - PubMed
    1. Wu, X. et al. MicroRNA: Another Pharmacological Avenue for Colorectal Cancer?. Front. Cell Dev. Biol.8, 812 (2020). - PMC - PubMed
    1. Zhao, R. et al. A novel tyrosine tRNA-derived fragment, tRFTyr, induces oncogenesis and lactate accumulation in LSCC by interacting with LDHA. Cell. Mol. Biol. Lett.28, 49 (2023). - PMC - PubMed

MeSH terms

LinkOut - more resources