. 2025 Jun;44(11):3266-3300.
doi: 10.1038/s44318-025-00422-3. Epub 2025 Apr 11.

Fibroblast hierarchy dynamics during mammary gland morphogenesis and tumorigenesis

Affiliations

Fibroblast hierarchy dynamics during mammary gland morphogenesis and tumorigenesis

Rosa Pascual et al. EMBO J. 2025 Jun.

Abstract

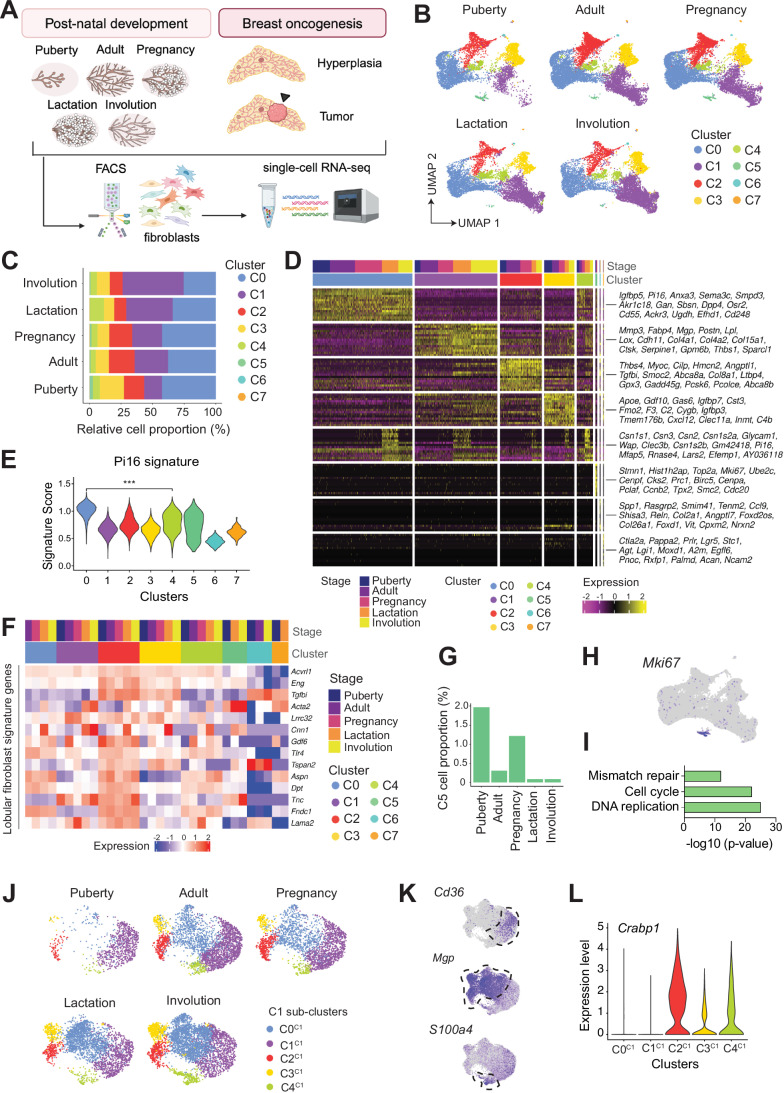
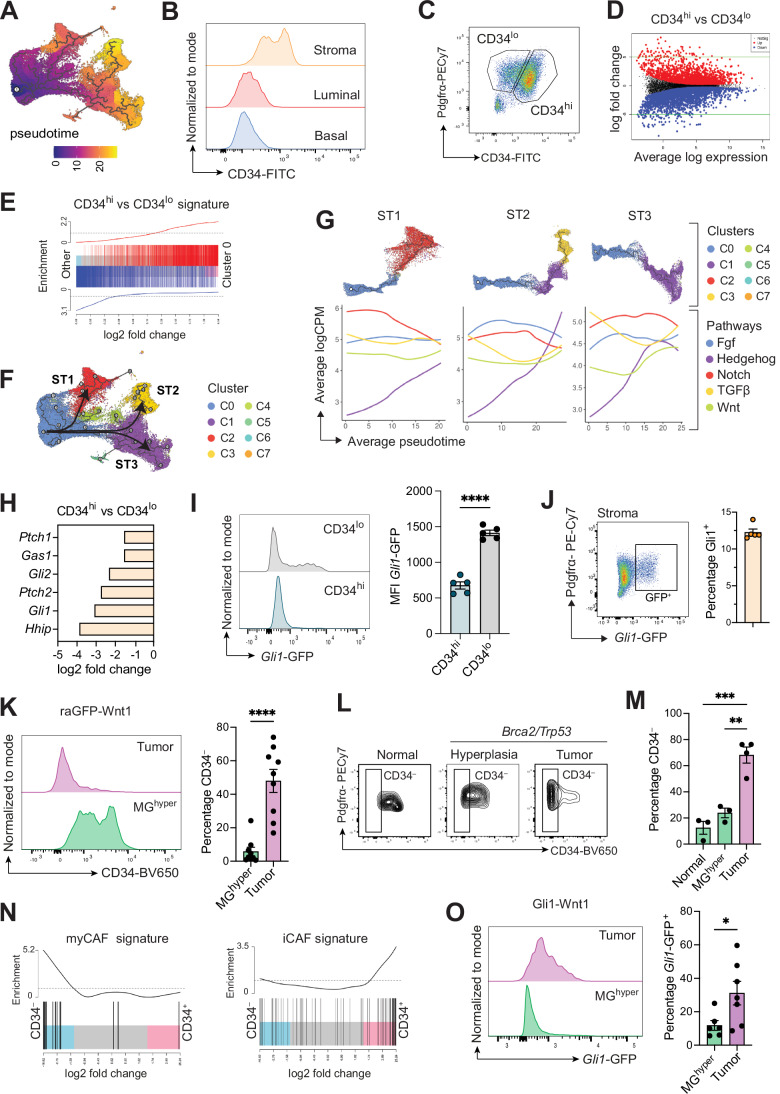
Fibroblasts form a major component of the stroma in normal mammary tissue and breast tumors. Here, we have applied longitudinal single-cell transcriptome profiling of >45,000 fibroblasts in the mouse mammary gland across five different developmental stages and during oncogenesis. In the normal gland, diverse stromal populations were resolved, including lobular-like fibroblasts, committed preadipocytes and adipogenesis-regulatory, as well as cycling fibroblasts in puberty and pregnancy. These specialized cell types appear to emerge from CD34high mesenchymal progenitor cells, accompanied by elevated Hedgehog signaling. During late tumorigenesis, heterogeneous cancer-associated fibroblasts (CAFs) were identified in mouse models of breast cancer, including a population of CD34- myofibroblastic CAFs (myCAFs) that were transcriptionally and phenotypically similar to senescent CAFs. Moreover, Wnt9a was demonstrated to be a regulator of senescence in CD34- myCAFs. These findings reflect a diverse and hierarchically organized stromal compartment in the normal mammary gland that provides a framework to better understand fibroblasts in normal and cancerous states.

Keywords: Cancer-Associated Fibroblasts (CAFs); Fibroblasts; Mammary Gland Development; Senescence; Wnt9a.


Conflict of interest statement

Disclosure and competing interests statement. The authors declare no competing interests.

Figures

Figure 1
Figure 1. Single-cell atlas of fibroblasts across post-natal developmental stages.
(A) Workflow for generation of a single-cell RNA sequencing (scRNA-seq, 10x Chromium platform) atlas of mouse mammary fibroblasts. Lineage-negative CD24-negative cells from C57BL/6 mice were isolated by FACS from five developmental stages: puberty (4.5-week old), adult (9-week-old virgin), pregnancy (14.5 days), lactation (10 days) and involution (4 days). CD45, CD31, and TER-119 were used as lineage markers. For breast oncogenesis, LinGFP+ cells from MMTV-Wnt1 Pdgfra-GFP tumors or hyperplastic mammary glands from the same mouse were isolated by FACS before scRNA-seq (n = 2). Created with BioRender.com. (B) UMAP plots of the integration analysis across the different developmental stages colored by cluster identity (C0–C7), including 6924 cells for puberty, 11,024 cells for adult, 10,470 cells for pregnancy, 8054 cells for lactation and 9302 cells for involution. (C) Relative cell proportion (%) of each cluster at each developmental stage. (D) Heatmap for gene expression showing the top 15 marker genes for each cluster at five developmental stages. (E) Violin plot for the enrichment of the Pi16 signature (Buechler et al, 2021) in each cluster. ***p < 0.001, Wilcoxon rank-sum test. (F) Heatmap of pseudo-bulk samples showing gene expression for marker genes of lobular fibroblasts (Morsing et al, 2016) in each cluster at five developmental stages. (G) Relative cell proportion of cycling fibroblasts (C5) in each developmental stage. The same data as in Fig. 1C, showing C5 alone for clarity. (H) UMAP plot colored by Mki67 expression. (I) Bar plot of top KEGG upregulated pathways in C5 vs the rest of clusters. Up or down-regulated genes were obtained by pseudo-bulk differential gene expression analysis. (J) UMAP plots of the sub-clustering of C1 colored by cluster identity (C0C1–C4C1) at the different developmental stages. (K) UMAP plots of the sub-clustering of C1 colored by expression of selected genes. (L) Violin plot for Crabp1 expression in the C1 subclusters (C0C1–C4C1).
Figure 2
Figure 2. Spatial distribution of Pdgfrα+ fibroblasts in the mammary gland.
(A) Representative flow cytometry plots for CD29 and CD24 expression in the LinPdgfra-GFP+ population in adult mammary glands (n = 15; 9–11-week old). (B) Percentage of Pdgfra-GFP+ cells in the stroma at different stages: puberty (n = 3, 4.5-week-old), adult (n = 4, 9–11-week-old virgin), pregnancy (n = 3, 14.5 days), lactation (n = 3, 10 days) and involution (n = 4, 4 days). Error bars, mean ± s.e.m. (C) Representative 3D confocal image and optical sections from an adult PdgfraH2B-GFP mammary gland (n = 3). Keratin 14 (K14), E-cadherin, and GFP are shown in magenta, cyan, and green, respectively. Scale bar, 100 μm for wholemounts and 50 µm for optical sections. (D) Representative flow cytometry plots for nuclear content (DAPI) and EdU incorporation in the stromal compartment (left) in puberty and pregnancy. Bar plot for the percentage of EdU-positive cells in the stroma (right). Each dot represents an individual mouse (n = 2 for adult and puberty, n = 3 for pregnancy 14.5 days). (E) Representative 3D confocal image and optical sections from pubertal PdgfraH2B-GFP mice injected with EdU 2 h prior to collection (6-week old, n = 2). Keratin 14 (K14), EdU and GFP shown in cyan, magenta and green, respectively. Scale bar, 100 μm for wholemounts and 50 µm for optical sections. Arrowheads indicate EdU+GFP+ double-positive cells. Source data are available online for this figure.
Figure 3
Figure 3. Changes in the fibroblast compartment upon acute hormonal stimulation.
(A) Representative flow cytometry plots for CD24 and CD29 expression in the Lineage-negative compartment of placebo control or MPA + E treated adult mice (left) (9-week old). Bar plot showing the ratio of the percentage of basal vs luminal cells in the epithelial compartment (right). Each dot represents an individual mouse (n = 4). Error bars, mean ± s.e.m. **p < 0.01, unpaired t-test. MPA medroxyprogesterone acetate, E estrogen. (B) UMAP plots of the Seurat integration analysis for cells from control (9495 cells) or MPA + E (12,216 cells) treated mice. Seven clusters (C0S–C6S) are indicated by color, S depicts clusters from the integration of the acute hormonal stimulation experiment (control and MPA + E). (C) UMAP plots of integrated data colored by expression of selected marker genes. (D) Relative cell proportion (%) of each cluster (C0S–C6S) for each treatment condition. (E) Representative immunostained images for CRABP1 in control (placebo) or MPA + E treated mammary glands (n = 6) (9-week old). Scale bar, 20 μm. (F) Quantification of the percentage of CRABP1+ cells in different mammary gland locations (epithelial, distal stromal, or periductal) using QuPath in control (placebo) or hormonal stimulation (MPA + E) (n = 6). Cells from one inguinal mammary gland section were quantified per mouse. Error bars indicate mean ± s.e.m., ****P < 0.0001, two-way ANOVA. (G) A number of upregulated and downregulated differentially expressed (DE) genes by pseudo-bulk analysis in the five main clusters for MPA + E vs control (placebo). (H) Expression heatmap showing the top ten marker genes in each cluster for either MPA + E or control conditions. (I) Violin plot showing enrichment of the Pi16 signature (Buechler et al, 2021) in C0S (mesenchymal progenitors) under control vs MPA + E conditions. ***p < 0.001, Wilcoxon rank-sum test. Source data are available online for this figure.
Figure 4
Figure 4. Predicted fibroblast hierarchy from CD34hi progenitor cells in homeostasis and tumors.
(A) UMAP plot colored according to the pseudo-time trajectory analysis with the starting node in C0 (mesenchymal progenitors). (B) Representative histogram of CD34 expression in stromal (CD24Pdgfrα+), luminal (CD29loCD24hi), and basal (CD29hiCD24lo) cells in adult FVB/NJ mice (9–10-week old) by flow cytometry (n = 10). (C) Representative flow cytometry plots for CD34 and Pdgfrα expression in the stromal (Lin CD24) compartment of pubertal 6-week-old FVB/NJ mice (n = 8). (D) Mean-difference plots showing differentially expressed genes between CD34hi and CD34lo fibroblasts from pubertal 6-week-old FVB/NJ mammary glands analyzed by RNA-seq (n = 3). Significantly upregulated and downregulated differentially expressed genes are shown as red and blue dots, respectively. (E) Barcode plot showing enrichment scores of CD34hi vs CD34lo transcriptional signature (bulk RNA-seq, n = 3) in C0 (mesenchymal progenitors) compared to other clusters. Red and blue bars indicate upregulated genes in CD34hi or CD34lo fibroblasts, respectively. (F) UMAP plot showing sub-trajectory analysis in the pseudo-time colored by cluster identity (C0–C7). Three sub-trajectories are indicated by arrows. ST, sub-trajectory. (G) Independent sub-trajectories (ST1-3) colored by cluster identity (above). Aggregated gene expression along the pseudo-time for specific signaling pathways indicated by color (below). (H) Log2 fold change for significantly upregulated Hedgehog-related genes in CD34lo vs CD34hi fibroblasts assessed by RNA-seq analysis (n = 3). (I) Representative histogram for Gli1-GFP expression in Pdgfrα+CD34hi/lo fibroblasts by flow cytometry (left). Bar plot for MFI of Gli1-GFP expression in Pdgfrα+CD34hi/lo (right). Each dot represents an individual mouse (n = 5). Error bars, mean ± s.e.m., ****p < 0.0001, unpaired t-test. MFI mean fluorescence intensity. (J) Representative flow cytometry plot of the stromal compartment for Pdgfrα and Gli1-GFP expression (left) and quantification of the percentage of Gli1-GFP+ cells in adult mammary glands (9-week old, right). Each dot represents an individual mouse (n = 5). Error bars, mean ± s.e.m. (K) Representative histograms of CD34 expression in Pdgfra-GFP+ cells from tumors or paired hyperplastic glands (MGhyper) from tumor-bearing raGFP-Wnt1 mice (left) and quantification of the percentage of CD34-negative cells in the Pdgfra-GFP+ compartment (right) assessed by flow cytometry. Each dot represents an individual mouse (n = 9). Error bars, mean ± s.e.m., ****p < 0.0001, unpaired t-test. (L) Representative flow cytometry plots of CD34 and Pdgfrα expression in the Pdgfrα+ population in hyperplastic mammary glands and tumors in MMTV-creT/+ Trp53 fl/+ Brca2fl/fl mice or littermate controls (normal, MMTV-cre+/+ Trp53 fl/+ Brca2fl/fl). n = 3 for normal and hyperplasia, n = 4 for tumors. (M) Quantification of the percentage of CD34 fibroblasts in the Pdgfrα+ compartment in hyperplastic mammary glands or tumors in MMTV-creT/+ Trp53 fl/+ Brca2fl/fl mice or littermate controls (normal, MMTV-cre+/+ Trp53 fl/+ Brca2fl/fl). n = 3 for normal and hyperplasia, n = 4 for tumors. Error bars, mean ± s.e.m., **p < 0.01, ***p < 0.001, ordinary one-way ANOVA. (N) Barcode plot showing enrichment scores of myCAF and iCAF transcriptional signatures (Elyada et al, 2019) in raGFP-Wnt1 CD34+/– CAFs analyzed by bulk RNA-seq (n = 3). (O) Representative histograms of Gli1-GFP expression in Pdgfrα+ cells from tumors or hyperplastic glands (MGhyper) derived from tumor-bearing Gli1-Wnt1 mice (left) and quantification of the percentage of Gli1-GFP+ cells in the Pdgfrα+ compartment (right) assessed by flow cytometry. Each dot represents an individual mouse for MGhyper (n = 6) or tumor (n = 7). Error bars, mean ± s.e.m., *p < 0.05, unpaired t-test.
Figure 5
Figure 5. Fibroblast changes through mammary oncogenesis.
(A) Representative brightfield images of organoids generated from normal basal or luminal progenitor (LP) cells grown with freshly sorted hyperplasia-associated fibroblasts (HAFs) or cancer-associated fibroblasts (CAFs) from the Wnt1 mouse model (n = 4). Scale bars, 200 μm. (B) Quantification of organoids generated from normal basal cells co-cultured with CAFs or HAFs (n = 4 independent sets of paired Wnt1 HAFs/CAFs). Error bars, mean ± s.e.m., ***p < 0.001, unpaired t-test. (C) UMAP plots of the Seurat integration analysis for GFP+ cells from raGFP-Wnt1 mice colored by cluster identity (C0W–C12W), including 12,981 cells for hyperplasia (HAFs) and 12,041 cells for tumors (CAFs). (D) Relative cell proportion (%) of each cluster (C0W–C12W) in hyperplastic tissue (HAFs) or tumors (CAFs) from raGFP-Wnt1 mice. (E) UMAP plots of the integrated Wnt1 data (raGFP-Wnt1 hyperplasia and tumors) colored by expression of selected markers. (F) UMAP plot of raGFP-Wnt1 hyperplasia-associated fibroblasts (HAFs) showing eight clusters (C0H–C7H) indicated by color. Clusters were annotated according to their expression profiles. (G) Heatmap of gene expression showing the top 15 marker genes for each cluster in raGFP-Wnt1 hyperplastic glands (C0H–C7H). (H) Representative immunostained images (left) and quantification (right) of the percentage of CRABP1-positive stromal cells in the periductal niche in raGFP-Wnt1 hyperplastic (n = 4, Pdgfra-GFPKI/+ MMTV-Wnt1T/+) or age-matched littermate (n = 3, Pdgfra-GFPKI/+ MMTV-Wnt1+/+) control tissues. Cells from one entire inguinal mammary gland section were quantified per mouse. Scale bar, 20 μm. Error bars indicate mean ± s.e.m., *P < 0.05, unpaired t-test. (I) Representative confocal images (left) of raGFP-Wnt1 hyperplastic (Pdgfra-GFPKI/+ MMTV-Wnt1T/+) or age-matched littermate (Pdgfra-GFPKI/+ MMTV-Wnt1+/+) control mammary glands (n = 4) stained with anti-CRABP1 (red), anti-GFP (fibroblasts, green), anti-α-SMA (myoepithelial marker, white) and DAPI (nuclei, blue). Scale bar, 20 μm. Quantification of CRABP1+ cells within GFP+ or GFP cells. Error bars indicate mean ± s.e.m., ***P < 0.001, ordinary one-way ANOVA (right). Source data are available online for this figure.
Figure 6
Figure 6. CD34 myCAFs emerge in mammary tumors.
(A) UMAP plot of raGFP-Wnt1 tumor fibroblasts showing seven CAF clusters (C0T-C6T) indicated by color. Clusters were annotated according to their expression profiles. (B) UMAP plots of raGFP-Wnt1 CAFs colored by enrichment for myCAF and iCAF signatures (Elyada et al, 2019) or Mki67 expression. Sign., transcriptional signature. (C) UMAP plots of raGFP-Wnt1 CAFs colored by the raGFP-Wnt1 CD34 vs CD34+ CAF signature generated by bulk differential gene expression analysis (n = 3) or Cd34 expression. Sign., transcriptional signature. (D) Violin plot for enrichment of CD34 CAF signature generated by bulk differential gene expression analysis (n = 3) in each raGFP-Wnt1 CAF cluster (C0T–C6T). ***p < 0.001, Wilcoxon rank-sum test. (E) Box plots for the enrichment of the mouse CAF transcriptional signatures for clusters C0T–C5T in normal human fibroblasts (n = 13) or in CAFs from different human breast cancer subtypes. ER estrogen receptor (n = 13). HER2 human epidermal growth factor receptor 2 (n = 6). TNBC triple-negative breast cancer (n = 8). Box plots show quartiles, minimum and maximum. Sign., transcriptional signature. (F) Bar plot of top KEGG upregulated pathways in each specific myCAF cluster (C0T, C1T, and C4T) vs all other CAF clusters. Down- or up-regulated genes for each cluster were obtained by pseudo-bulk differential gene expression analysis. (G) Violin plots for the enrichment of the senescence signature (Fridman and Tainsky, 2008) in each tumor cluster (C0T–C6T). ***p < 0.001, Wilcoxon rank-sum test. (H) UMAP plots of normal fibroblasts, raGFP-Wnt1 hyperplasia-associated fibroblasts (HAFs), and raGFP-Wnt1 cancer-associated fibroblasts (CAFs) colored by Cdkn2a expression. (I) Mean-difference plot showing differentially expressed genes between raGFP-Wnt1 CD34+ and CD34 CAFs analyzed by bulk RNA-seq (n = 3). Significantly upregulated and downregulated genes are shown as red and blue dots, respectively. (J) Heatmap of expression of senescence-associated genes in raGFP-Wnt1 CD34 vs CD34+ CAFs (bulk RNA-seq, n = 3). (K) Representative brightfield images of β-galactosidase staining of raGFP-Wnt1 CD34+ or CD34 CAFs treated with vehicle or etoposide. Scale bars, 100 μm. (left). Quantification of the percentage of β-galactosidase (β-gal) positive cells (right). Each dot represents a technical duplicate, n = 4 independent experiments with two independent sets of primary CAFs. Error bars, mean ±  s.e.m., **p < 0.01,****p < 0.0001, ordinary one-way ANOVA. Source data are available online for this figure.
Figure 7
Figure 7. Wnt9a contributes to the senescent phenotype of CD34 myCAFs.
(A) Venn diagram showing the overlap between significantly upregulated genes in raGFP-Wnt1 CD34 vs CD34+ CAFs (bulk RNA-seq, n = 3) and in raGFP-Wnt1 tumors vs hyperplastic glands (all fibroblasts, by pseudo-bulk scRNA-seq, n = 2) (left). PANTHER pathway analysis showing the seven most significantly enriched pathways in a donut plot (right). (B) Violin plot showing Wnt9a expression in each raGFP-Wnt1 CAF cluster (C0T–C6T). (C) Representative brightfield images of β-galactosidase staining of raGFP-Wnt1 CD34 myCAFs CRISPR-edited for Wnt9a (sgWnt9a#1 and #2) or control guide (sgNT, non-target) treated with either vehicle or etoposide. Arrows depict β-gal+ cells. Scale bars, 100 μm. (D) Quantification of the percentage of β-galactosidase-positive raGFP-Wnt1 CD34 myCAFs, either Wnt9a-KO or control (sgNT, non-target) treated with etoposide. Values were normalized to the average of the control (etoposide-treated sgNT) for each experiment. Each dot represents a technical duplicate, n = 4 experiments with two independent sets of primary CAFs. Error bars, mean ± s.e.m., ****p < 0.0001, ordinary one-way ANOVA. (E) Western blot analysis showing expression of p21 and p16 in control (sgNT) or Wnt9a-KO raGFP-Wnt1 CD34 myCAFs treated with vehicle or etoposide (n = 3). Vinculin and α-tubulin were used as a loading control. (F) Model of the evolving mammary fibroblast hierarchy during normal post-natal development and mammary oncogenesis. Created with BioRender.com. Hh Hedgehog, myCAF myofibroblastic CAF, senCAF senescent CAF, iCAF inflammatory CAF. Source data are available online for this figure.
Figure EV1
Figure EV1. Normal mammary fibroblast clusters.
(A) UMAP plots showing cell types for individual stages before removing contaminant cells (see Table 1). (B) UMAP plot of integrated data from all developmental stages colored by Bmp5 expression. (C) Violin plot showing enrichment of the C2 normal signature (lobular-like fibroblasts) in fibroblast clusters found in other tissues (Buechler et al, 2021). Upregulated genes in C2 were used to generate the lobular-like fibroblast signature. (D) Bar plot of top KEGG upregulated pathways in one cluster vs the rest. Down- or upregulated genes for each cluster were obtained by pseudo-bulk differential gene expression analysis. (E) UMAP plots of integrated data from all developmental stages colored by expression of selected top marker genes for C3. (F) Heatmap of gene expression showing the top 15 markers genes for clusters in C1 subclusters (COC1–C4C1). (G) UMAP plot for the C1 sub-clustering analysis colored by Fabp4 expression (H) UMAP plot colored by Dlk1 expression (integrated data for all developmental stages). (I) Boxplots for enrichment score of C1 or C2 normal fibroblast transcriptional signatures (Sign.) in human breast tissue with high versus low mammographic density (MD) (Kumar et al, 2023). Box plots show quartiles, minimum and maximum. ***p < 0.001, Wilcoxon rank-sum test. (J) UMAP plots for an independent integrated scRNA-seq dataset for puberty and adult stages colored by cluster identity (clusters 0–4). (K) Dot plot visualization of expression of selected marker genes in each cluster (from Fig. EV1J). The orange square highlights highly expressed genes in cluster 1. The size of the dot encodes the percentage of cells within a cluster, while the color encodes the average expression levels across all cells within a cluster. (L) UMAP plots of the sub-clustering of cluster 1 (from Fig. 1EVJ) colored by cluster identity. (M) Violin plot for Crabp1 expression in the cluster 1 subclusters (from Fig. 1EVI).
Figure EV2
Figure EV2. Characterization of fibroblasts using the PdgfraH2B-GFP model.
(A) UMAP plot colored by Pdgfra expression. (B) Mean fluorescence Intensity (MFI) of Pdgfrα-GFP levels in the luminal, basal and stromal compartments. Each dot represents an individual mouse (n = 4). Error bars, mean ± s.e.m. (C) Gating strategy in the PdgfraH2B-GFP reporter mouse model. (D) Representative 3D confocal image and sections of a pubertal PdgfraH2B-GFP mammary gland (6-week old, n = 3). Keratin 14 (K14), E-cadherin and GFP shown in magenta, cyan and green, respectively. Scale bar, 100 μm for wholemounts and 50 µm for optical sections. (E) Representative confocal image showing a 6-week-old PdgfraH2B-GFP mammary gland stained with anti-Collagen IV (ColIV, basement membrane, magenta), anti-α-SMA (myoepithelial, yellow), anti-GFP (fibroblasts, green) and DAPI (gray) (n = 3). Scale bar, 100 and 50 μm for zoomed-in images. (F) Representative 3D confocal image and optical sections from 12.5-day pregnant PdgfraH2B-GFP mice injected with EdU 2 h prior to collection (n = 2). Keratin 14 (K14), EdU and GFP shown in cyan, magenta and green, respectively. Scale bar, 100  μm for wholemounts and 50 µm for optical sections.
Figure EV3
Figure EV3. Fibroblast subsets during acute hormonal stimulation and characterization of CD34hi/lo fibroblasts.
(A) Violin plots showing enrichment of signatures from normal fibroblast clusters in each stimulation cluster (C0S-C6S). Upregulated genes in each normal cluster (post-natal development) were used to generate cluster-specific signatures. (B) Snapshot of QuPath classification of mammary niches used in Fig. 3F. Scale bar, 20 µm. (C) Separate UMAP plots for control or MPA + E conditions colored by expression of Igfbp5. (D) UMAP plots of integrated data across post-natal development colored by expression of Esr1 (left) and Pgr (right). (E) Representative 3D confocal image and optical section from a PdgfraH2B-GFP mammary gland showing PR (progesterone receptor, magenta), K14 (Keratin 14, cyan), and GFP (fibroblasts, green) (n = 2). Scale bars, 100 μm. Double GFP+PR+ cells are highlighted with white arrowheads. (F) Violin plots of Cd34 expression in each cluster. ***p < 0.001, Wilcoxon rank-sum test. (G) Bar plot of top Gene Ontology (GO) upregulated pathways in CD34lo vs CD34hi fibroblasts by bulk RNA-seq (n = 3). (H) Volcano plot illustrating the statistical significance (−log10 p value) versus the magnitude of proteomic changes (log2 fold change) in the secretomes of CD34hi versus CD34lo cultured fibroblasts by mass spectrometry analysis (n = 3). Proteins were deemed differentially regulated when the log2 fold change in protein expression was ≥1-fold and exhibited an adjusted p value ≤0.05. (I) Gene ontology pathway analysis of significantly enriched local network clusters (STRING) for proteins upregulated in the CD34hi vs CD34lo secretomes (n = 3). For STRING network, active interaction sources include experiments, databases, and co-expression; and minimum required interaction score was 0.700 (medium). FDR, false discovery rate. (J) Gene ontology pathway analysis of significantly enriched local network clusters (STRING) for proteins upregulated in CD34lo vs CD34hi fibroblast secretomes (n = 3). For STRING network active interaction sources include experiment, databases and co-expression; and minimum required interaction score was 0.700 (medium). FDR, false discovery rate.
Figure EV4
Figure EV4. Characterization of Gli1+ specialized fibroblasts.
(A) Targeting strategy to generate Gli1 rtTA3-IRES-EGFP-pA reporter mice. WT, wild-type. rtTA, reverse tetracycline‐controlled trans‐activator. IRES, internal ribosome entry sites. UTR, untranslated region. (B) Gating strategy for the Gli1-rtTA-IRES-GFP KI mouse model (n = 8). (C) mRNA expression of Gli1, Gli2, Ptch1, and Ptch2 normalized to Gapdh expression in Gli1-GFP and Gli1-GFP+ mammary fibroblasts sorted from adult female mice. Each dot represents an individual mouse (n = 5). Error bars, mean ± s.e.m., ****p < 0.0001, two-way ANOVA. (D) Mean Fluorescence Intensity (MFI) of Gli1-GFP expression in basal (CD29hi CD24lo), luminal (CD29lo CD24hi) and stromal (CD24) populations. Each dot represents an individual mouse (n = 3). Error bars, mean ± s.e.m., ****p < 0.0001, ordinary one-way ANOVA. (E) Percentage of Pdgfrα-, Pdgfrβ- or Pdpn (Podoplanin)-positive cells in Gli1-GFP+/– stroma assessed by flow cytometry. Each dot represents an individual mouse (n = 5). Error bars, mean ± s.e.m., ***p < 0.001, two-way ANOVA. (F) Representative histograms for Pdpn expression in Pdgfrα+CD34hi/lo fibroblasts from 6-week-old FVB/NJ mice by flow cytometry (n = 3). (G) Bar plot of MFI for Pdpn levels in Pdgfrα+CD34hi/lo populations in pubertal (6-week old, n = 3) and adult (9-week old, n = 3) FVB/NJ mice. Error bars, mean ± s.e.m., *p < 0.05, **P < 0.01, unpaired t-test. MFI mean fluorescence intensity. (H) Workflow for 2D co-culture assays with primary irradiated fibroblasts and freshly sorted basal epithelial cells. Created with BioRender.com. (I) Representative images (left) and quantification (right) of basal colonies seeded with Pdgfrα+ Gli1-GFP+ or Pdgfrα+ Gli1-GFP cells (n = 6). Each dot represents the average of three replicates, each condition includes two independent sets of fibroblasts. Error bars, mean ± s.e.m., ***p < 0.001, unpaired t-test. Scale bar, 5 mm. (J) Representative images (left) and quantification (right) of basal/myoepithelial colonies seeded with Pdgfrα+CD34hi/lo fibroblasts (n = 5). Each dot represents the average of three replicates, each condition includes two independent sets of fibroblasts. Error bars, mean ± s.e.m., *p < 0.05, unpaired t-test. Scale bar, 5 mm. (K) mRNA expression of Cd34 (left) or Col1a51a1 (right) genes normalized to Gapdh expression (housekeeping gene) in CD34hi and CD34lo mammary fibroblasts freshly sorted or after one passage in culture. Each expression value for CD34hi cells was normalized to their CD34lo counterpart. Each dot represents an individual mouse (n = 4). Error bars, mean ± s.e.m., **p < 0.01, ****p < 0.0001, ordinary one-way ANOVA. (L) Mean fluorescence intensity (MFI) of CD34 expression in Gli1-GFP+/– CAFs from Gli1-Wnt1 tumors, normalized by the Gli1-GFP population for each tumor. Each dot represents a tumor (n = 6). Error bars, mean ± s.e.m. Source data are available online for this figure.
Figure EV5
Figure EV5. Characterization of hyperplasia- and cancer-associated fibroblasts.
(A) Representative images of 3D colony-forming assays with basal and luminal progenitor (LP) cells without fibroblasts. Scale bars, 200 μm. (B) CellTiter-Glo (CTG) values, normalized to day 1, were used to assess the growth of HAFs and CAFs. n = 3 sets of matched raGFP-Wnt1 HAFs and CAFs. Error bars, mean ± s.e.m. (C) Representative images of 3D colony-forming assays with luminal progenitor (LP) cells from hyperplastic glands (16-week-old FVB-Wnt1T/+) or littermate controls (FVB-Wnt1+/+) co-cultured with Pdgfrα+ fibroblasts. Scale bars, 200 μm. (D) Quantification of the percentage of stroma (LinCD24) in raGFP-Wnt1 hyperplastic mammary glands and tumors. Each dot represents an individual mouse (n = 9). Error bars, mean ± s.e.m., **p < 0.01, unpaired t-test. (E) Violin plots for the enrichment of signatures from normal fibroblast clusters in each raGFP-Wnt1 HAF cluster (C0H-C7H). Upregulated genes in each normal cluster were used to generate cluster-specific signatures. HAF clusters are indicated by color. (F) UMAP plot of HAFs in Brca2/Trp53-deficient hyperplastic tissue showing ten clusters (C0H2-C9H2) indicated by color. Clusters were annotated according to their expression profiles. (G) Heatmap of gene expression for the top 10 marker genes for each HAF cluster in Brca2/Trp53-deficient glands (C0H2-C9H2). (H) UMAP plot (raGFP-Wnt1 CAFs) colored by expression of selected marker genes. (I) UMAP plots (raGFP-Wnt1 HAF and CAFs) colored by expression of Acta2. (J) Box plots showing enrichment of the mouse C6T CAF cluster transcriptional signature in normal human fibroblasts (n = 13) or CAFs in different breast cancer subtypes. ER, estrogen receptor (n = 13). HER2, human epidermal growth factor receptor 2 (n = 6). TNBC, triple-negative breast cancer (n = 8). Box plots show quartiles, minimum and maximum. (K) Box plots showing enrichment of the raGFP-Wnt1 CD34 CAF signature generated by bulk differential gene expression analysis (n = 3) in normal human fibroblasts or CAFs in different breast cancer subtypes. Box plots show quartiles, minimum and maximum. (L) Heatmap showing expression of the top 15 marker genes for each cluster in raGFP-Wnt1 CAFs (C0T–C6T).
Figure EV6
Figure EV6. Molecular features of CD34 myCAFs.
(A) Violin plots for enrichment of the ecm-myCAF signature (Kieffer et al, 2020) in each tumor cluster (C0T–C6T). (B) UMAP plot (raGFP-Wnt1 CAFs) colored by Lrrc15 expression. (C) UMAP plot (CAFs, Brca2/Trp53-deficient model) showing four clusters (C0T2–C3T2) indicated by color. (D) UMAP plot (CAFs, Brca2/Trp53-deficient model) colored by expression of Cd34 (left) and Lrrc15 (right). (E) Cell counts for CD34+ or CD34 raGFP-Wnt1 CAFs treated with vehicle or etoposide normalized to day 0 (n = 4, two independent sets of primary fibroblasts). Error bars, mean ± s.e.m. (F) Multidimensional scaling (MDS) plot for pseudo-bulk gene expression analysis of all fibroblasts in normal tissue (puberty + adult), hyperplastic tissue (MGhyper, n = 2), and tumors (n = 2). (G) Mean-difference plot showing differentially expressed genes between fibroblasts in tumors vs hyperplastic glands MGhyper (n = 2). Significantly upregulated and downregulated genes are shown as red and blue dots, respectively. (H) Wnt9a expression in pseudo-bulk data for normal, hyperplastic (raGFP-Wnt1 MGhyper, n = 2) and raGFP-Wnt1 tumor states (n = 2). (I) Percentage of Wnt9a+ fibroblasts in hyperplastic tissue and tumors in Brca2/Trp53-deficient mice assessed by scRNA-seq (n = 2 mice per timepoint). (J) Percentage of WT (wild-type) or mutated (indels) sequences in CD34 myCAFs transduced with sgRNAs targeting the Wnt9a locus (sgWnt9a). Each dot represents a replicate (n = 2). ****p < 0.0001, unpaired t-test. Error bars, mean ± s.e.m. (K) CellTiter-Glo (CTG) values, normalized to day 1, to assess growth of control (sgNT) and Wnt9a-KO CD34 myCAFs. n = 2 independent sets of CRISPR-edited CD34 myCAFs performed in triplicate. Error bars, mean ± s.e.m. (L) Quantification of the percentage of β-galactosidase+ CD34 myCAFs, either Wnt9a-KO or control (sgNT) cells treated with vehicle or etoposide. Values were normalized to the average of the untreated control for each experiment. Raw values for the etoposide-treated conditions are the same as in Fig. 6I. Each dot represents a technical duplicate, n = 4 independent experiments with two independent sets of primary CAFs. Error bars, mean ± s.e.m. (M) Quantification of p21 (left) and p16 (right) protein band density, normalized to Vinculin, evaluated by western blot analysis of control (sgNT) or Wnt9a-KO raGFP-Wnt1 CD34 myCAFs treated with vehicle or etoposide (n = 3). Error bars, mean ± s.e.m.

References

    1. Abbasi S, Sinha S, Labit E, Rosin NL, Yoon G, Rahmani W, Jaffer A, Sharma N, Hagner A, Shah P et al (2020) Distinct regulatory programs control the latent regenerative potential of dermal fibroblasts during wound healing. Cell Stem Cell 27:396–412.e396 - PubMed
    1. Adams PD, Enders GH (2008) Wnt signaling and senescence: a tug of war in early neoplasia? Cancer Biol Ther 7:1706–1711 - PMC - PubMed
    1. Ashburner M, Ball CA, Blake JA, Botstein D, Butler H, Cherry JM, Davis AP, Dolinski K, Dwight SS, Eppig JT et al (2000) Gene ontology: tool for the unification of biology. The Gene Ontology Consortium. Nat Genet 25:25–9 - PMC - PubMed
    1. Bankhead P, Loughrey MB, Fernández JA, Dombrowski Y, McArt DG, Dunne PD, McQuaid S, Gray RT, Murray LJ, Coleman HG et al (2017) QuPath: Open source software for digital pathology image analysis. Sci Rep 7:16878 - PMC - PubMed
    1. Bartoschek M, Oskolkov N, Bocci M, Lövrot J, Larsson C, Sommarin M, Madsen CD, Lindgren D, Pekar G, Karlsson G et al (2018) Spatially and functionally distinct subclasses of breast cancer-associated fibroblasts revealed by single cell RNA sequencing. Nat Commun 9:5150 - PMC - PubMed

MeSH terms

LinkOut - more resources