. 2025 Apr 11;5(1):110.
doi: 10.1038/s43856-025-00816-8.

Rescue of lysosomal acid lipase deficiency in mice by rAAV8 liver gene transfer

Affiliations

Rescue of lysosomal acid lipase deficiency in mice by rAAV8 liver gene transfer

Marine Laurent et al. Commun Med (Lond). .

Abstract

Background: Lysosomal acid lipase deficiency (LAL-D) is an autosomal recessive disorder caused by mutations in the LIPA gene, which results in lipid accumulation leading to multi-organ failure. If left untreated, the severe form of LAL-D results in premature death within the first year of life due to failure to thrive and hepatic insufficiency. Weekly systemic injections of recombinant LAL protein, referred as enzyme replacement therapy, is the only available supportive treatment.

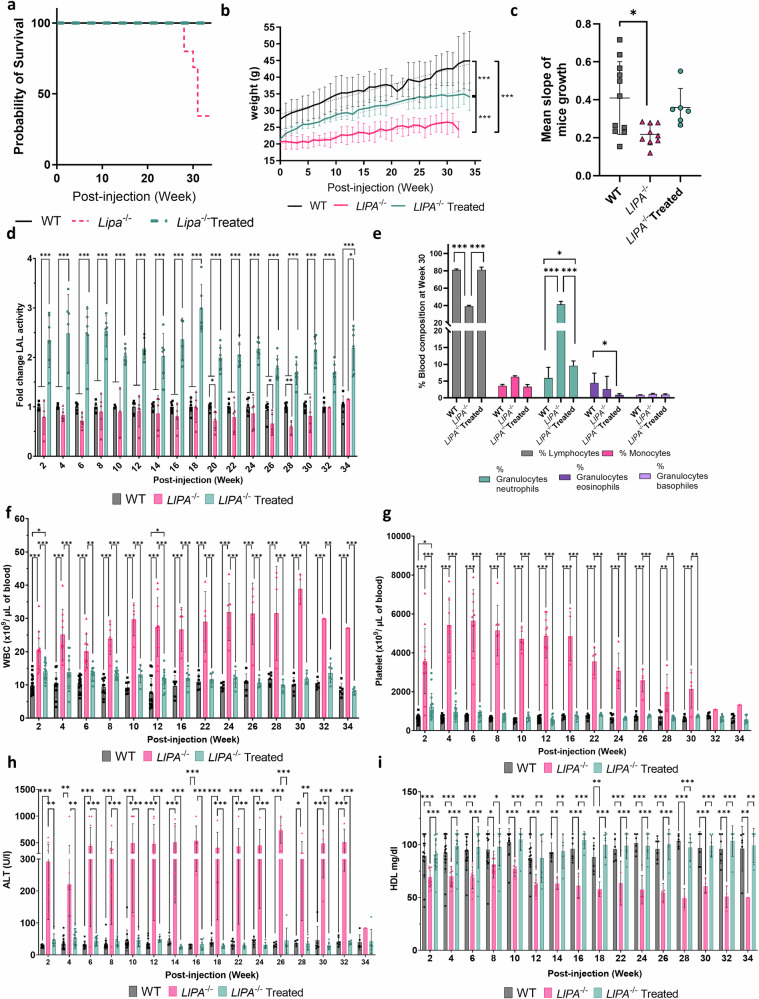
Method: Here, we characterized a novel Lipa-/- mouse model and developed a curative gene therapy treatment based on the in vivo administration of recombinant (r)AAV8 vector encoding the human LIPA transgene under the control of a hepatocyte-specific promoter.

Results: Here we define the minimal rAAV8 dose required to rescue disease lethality and to correct cholesterol and triglyceride accumulation in multiple organs and blood. Finally, using liver transcriptomic and biochemical analysis, we show mitochondrial impairment in Lipa-/- mice and its recovery by gene therapy.

Conclusions: Overall, our in vivo gene therapy strategy achieves a stable long-term LAL expression sufficient to correct the disease phenotype in the Lipa-/- mouse model and offers a new therapeutic option for LAL-D patients.

Plain language summary

Lysosomal acid lipase (LAL) deficiency is a rare genetic disorder that causes toxic lipid build-up in liver and other organs and causes death during childhood if untreated. This study aimed to develop a treatment to cure this disorder by introducing a healthy copy of the LAL gene (gene that causes the disorder). We tested this in a mouse model that lacks this gene and has symptoms similar to the human disorder. We found that this treatment could effectively prevent disease symptoms and reverse damage in affected tissues. This promising gene therapy could offer a potential long-term cure for LAL deficiency, providing hope for patients with this life-threatening condition in the future.


Conflict of interest statement

Competing interests: The authors declare no competing interests.

Figures

Fig. 1
Fig. 1. Evaluation of different rAAV8 doses in Lipa−/− mice.
a Experimental outline created by BioRender.com. 10–12-week-old mice were injected with the indicated rAAV8 doses and disease progression was monitored for 12-weeks post-injection. LD low dose, MD middle dose, HD high dose, vg vector genome. b Left panel: Mice weight (gr: grams) was recorded every week. Right panel: Linear slopes of mice weight. c Fold change of LAL activity over WT mice measured in plasma samples every 2-weeks post-injection. d Blood cell populations in blood samples collected at 12-weeks post-injection. e White blood cell (WBC) and f platelet count in blood samples collected every 4-weeks post-injection. Quantification of (g) ALT (U/L, unit per liter) and (h) HDL in plasma samples collected every 2-weeks post-injection. Bars indicate mean ± SD (n = 3-4) and statistical significance was calculated using two-way ANOVA with Tukey’s test (*p < 0.033; **p < 0.002; ***p < 0.0002). Exact p value is indicated in Supplementary Data 1.
Fig. 2
Fig. 2. rAAV8 transduction of liver and spleen of Lipa−/− mice increases LAL activity and corrects hepatosplenomegaly.
rAAV8 transduction level for different vector doses at 12-weeks post injection (a) in liver and (b) spleen. vg vector genome. Fold change of LAL activity over WT mice (c) in liver and (d) spleen for different vector doses. Weight of (e) liver and (f) spleen at 12-weeks post-injection for different vector doses. g Representative images of liver and spleen at 12-weeks post-injection. Ruler indicates centimetres. Bars indicate mean ± SD (n = 3-4) and statistical significance was calculated using two-way ANOVA with Tukey’s test (*p < 0.033; **p < 0.002; ***p < 0.0002). Exact p value is indicated in Supplementary Data 1.
Fig. 3
Fig. 3. rAAV8 administration corrects lipid accumulation in liver and spleen.
Quantification of cholesterol and triglycerides in (a, b) liver and (c, d) spleen at 12-weeks post-injection. mg = milligrams. Bars indicate mean ± SD (n = 3-4) and statistical significance was calculated using one-way ANOVA with Tukey’s test (*p < 0.033; **p < 0.002; ***p < 0.0001). Exact p value is indicated in Supplementary Data 1. e Histological sections: Oil red O (ORO), Haematoxylin Eosin Saffron (HES) and Sirius red (SR) staining of liver (top panel), spleen (bottom panel) at 12-weeks post-injection (scale bar: 50 µm unless differently noted).
Fig. 4
Fig. 4. rAAV8 administration increases survival and body weight of male Lipa−/− mice and corrects haematological parameters and dyslipidaemia for 34-weeks post-injection.
a Percentage of mice survival. b Mice weight (gr: grams) was recorded every week (n = 6-11). c Linear slopes of mice weight. Bars indicate mean ± SD (n = 3-4) and statistical significance was calculated using one-way ANOVA with Turkey’s Test (*p < 0.033; **p < 0.002; ***p < 0.0002). Exact p value is indicated in Supplementary Data 1. d Fold change of LAL activity over WT mice measured in plasma samples every 2-weeks post-injection (n = 3-11). e Blood cell populations in blood samples collected at 30-weeks post-injection (n = 3-6). f White blood cell (WBC) and (g) platelet counts in blood samples collected every 2-weeks post-injection (n = 1-20). Quantification of (h) ALT (U/L, unit per liter) and (i) HDL in plasma samples collected every 2-weeks post-injection (n = 1-20). Bars indicate mean ± SD and statistical significance was calculated using two-way ANOVA with Tukey’s test (*p < 0.033; **p < 0.002; ***p < 0.0002). Exact p value is indicated in Supplementary Data 1.
Fig. 5
Fig. 5. rAAV8 transduction of liver and spleen of Lipa−/− mice results in long-term increase of LAL activity and correction of hepatosplenomegaly.
rAAV8 transduction level in (a) liver and (b) spleen at indicated time points (weeks) (n = 4-10). vg vector genome. Fold change of LAL activity over WT mice in (c) liver and (d) spleen at indicated time points (weeks). Weight of (e) liver and (f) spleen at indicated time points (weeks). g Representative images of liver and spleen at 12-weeks post-injection. Bars indicate mean ± SD (n = 4-10) and statistical significance was calculated using two-way ANOVA with Tukey’s test (*p < 0.033; **p < 0.002; ***p < 0.0002). Exact p value is indicated in Supplementary Data 1.
Fig. 6
Fig. 6. rAAV8 administration corrects lipid accumulation in liver and spleen long-term.
Quantification of cholesterol and triglycerides in (a, b) liver and (c, d) spleen at indicated time points (weeks). Bars indicate mean ± SD (n = 4-10). Statistical significance was calculated using two-way ANOVA with Tukey’s test (*p < 0.033; **p < 0.002; ***p < 0.0001). Exact p value is indicated in Supplementary Data 1. e Histological sections with: Oil red O (ORO; top row), Haematoxylin Eosin Saffron (HES; middle row) and Sirius red (SR; bottom row) staining of liver (top panel), and spleen (bottom panel) at 4- and 34-weeks (scale: 50 µm).
Fig. 7
Fig. 7. rAAV8 administration corrects expression of gene related to metabolic, immune, and mitochondria.
Differential mRNA expression analysis was performed on liver WT, Lipa−/− and rAAV8-treated Lipa−/− mice. a Principal component analysis (PCA) visualizes the separation between experimental groups. b Volcano plots display genes according to log2 fold change and -log10 P value. Colour shade indicates the log10 mean expression level of all analysed animals (n = 3). For some dots the associated gene name is indicated. On top of each plot, the names indicate the samples compared, while the numbers indicate how many genes (dots) are present in each quadrant. Vertical dotted lines indicate ± 2-fold change. c Gene ontology analysis by Gene Set Enrichment Analysis (GSEA). Colour shades indicate normalized enrichment score (NES) of the indicated mice group comparison at 12- and 34-weeks post-injection. d, e Representative traces of the oxygen consumption rates (OCRs) in liver of WT, Lipa−/− and rAAV8-treated Lipa−/− mice at 34-weeks post-treatment. Where indicated, the following compounds were injected into the assay micro-chambers: NADH, Rotenone+Antimycin A (Rot+Ant A), Succinate+Rotenone (Succ+Rot), Antimycin A (AntA), Asc/TMPD (ascorbate+ TMPD), Azide. f Metabolic parameters inferred from the OCR assays and corrected for residual activity in the presence of the respiratory chain inhibitors for mitochondria isolated from mouse at 34- weeks post injection. Bars indicate mean ± SD (n = 3-4 with 3 or 4 biological replicates for each group) and statistical significance was calculated using two-way ANOVA with Bonferroni post-hoc analysis (*p < 0.033; **p < 0.002; ***p < 0.0002). Exact p value is indicated in Supplementary Data 1. % of CD68-stained area per section in the liver (g) and spleen (h) at 34-weeks post-treatment. Bars indicate mean ± SD (n = 3-6) and statistical significance was calculated using one-way ANOVA with Kruskal-Wallis Test (*p < 0.033; **p < 0.002; ***p < 0.0002). Exact p value is indicated in Supplementary Data 1.

Similar articles

References

    1. Brown, W. V., Desnick, R. J. & Grabowski, G. A. JCL Roundtable: enzyme replacement therapy for lipid storage disorders. J. Clin. Lipidol.8, 463–472 (2014). - PubMed
    1. Aqul, A. A. et al. Molecular markers of brain cholesterol homeostasis are unchanged despite a smaller brain mass in a mouse model of cholesteryl ester storage disease. Lipids57, 3–16 (2022). - PMC - PubMed
    1. Balwani, M. et al. Lysosomal acid lipase deficiency manifestations in children and adults: Baseline data from an international registry. Liver Int. n/a (2023). - PubMed
    1. da, C. et al. Lysosomal acid lipase deficiency in pediatric patients: a scoping review. J. Pediatr. (Rio J.)98, 04–14 (2022). - PMC - PubMed
    1. Bernstein, D. L. et al. Lysosomal acid lipase deficiency allograft recurrence and liver failure- clinical outcomes of 18 liver transplantation patients. Mol. Genet. Metab.124, 11–19 (2018). - PubMed

LinkOut - more resources