. 2025 Jul;44(26):2158-2169.
doi: 10.1038/s41388-025-03380-6. Epub 2025 Apr 11.

Protein disulfide isomerase-enriched extracellular vesicles from bladder cancer cells support tumor survival and malignant transformation in the bladder

Affiliations

Protein disulfide isomerase-enriched extracellular vesicles from bladder cancer cells support tumor survival and malignant transformation in the bladder

Chia-Hao Wu et al. Oncogene. 2025 Jul.

Abstract

Bladder cancer (BC) patients face high rates of disease recurrence, partially driven by the cancer field effect. This effect is mediated in part by the release of pro-tumorigenic cargos in membrane-enclosed extracellular vesicles (EVs), but the specific underlying mechanisms remain poorly understood. Protein disulfide isomerase (PDIA1) catalyze disulfide bond formation and can help mitigate endoplasmic reticulum (ER) stress, potentially supporting tumor survival. Here, BC cells were found to exhibit better survival under ER stress when PDIA1 was downregulated. These cells maintained homeostatic PDIA1 levels through the EV-mediated release of PDIA1. Chronic exposure of urothelial cells to these PDIA1-enriched BCEVs induced oxidative stress and DNA damage, ultimately leading to the malignant transformation of recipient cells. The EV-transformed cells exhibited DNA damage patterns potentially attributable to oxidative damage, and PDIA1 was found to be a key tumorigenic cargo within EVs. Tissue microarray analyses of BC recurrence confirmed a significant correlation between tumor recurrence and the levels of both PDIA1 and ER stress. Together, these data suggest that cancer cells selectively sort oxidized PDIA1 into EVs for removal, and these EVs can, in turn, induce oxidative stress in recipient urothelial cells, predisposing them to malignant transformation and thereby increasing the risk of recurrence.


Conflict of interest statement

Competing interests: The authors declare no competing interests. Ethics approval and consent to participate: All methods were performed in accordance with the relevant guidelines and regulations. Approval was obtained from the Research Subjects Review Board, the University of Rochester’s Institutional Review Board under STUDY00005593 prior to the construction and use of the Tissue Microarray. Informed consent was obtained from the subjects prior to the tissue collection. All specimens were de-identified to use and no patient identifiers are included in the publication.

Figures
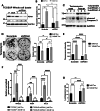
Fig. 1
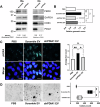
Fig. 1. Reduced PDIA1 expression promotes bladder cancer cell survival under elevated ER stress.
A Western blot analysis of PDIA1 abundance in cell lysates derived from scramble control and PDIA1-targeting lentiviral shRNA transduced TCCSUP cells. The two clones exhibiting the lowest PDIA1 expression were used for future experiments. TCCSUP cell death was measured by propidium iodide (PI) staining and quantified using flow cytometry (B). Apoptosis was assessed by Western blotting analyses of cleaved caspase-3 (C), BiP was used as a marker for ER stress. D TCCSUP cancer cell survival following tunicamycin treatment was tested in a clonogenic assay. Scramble control and shPDIA1 TCCSUP cells were treated with tunicamycin (140 nM Tun; in DMSO) or vehicle control (DMSO) and examined to assess H2O2 levels (D), oxidative stress gene expression (E), and the GSH/GSSG ratio (F). For (B), (D), (E), individual genes in (F), and (G), two-way ANOVAs were performed with Fisher’s LSD multiple comparison test; n = 3; error bars indicate means ± standard deviation. *p < 0.05, **p < 0.01, ***p < 0.001, ****p < 0.0001. P parental TCCSUP, SCR scramble control, EV extracellular vesicle, PDIA1 protein disulfide isomerase A1, shPDIA1-1/2 one of two short hairpin RNAs targeting PDIA1, PI propodium iodide, BiP binding immunoglobulin protein, ANOVA analysis of variance, DMSO dimethyl sulfoxide, Tun tunicamycin, NFE2L2 Nuclear factor erythroid-derived 2-like 2, NQO1 NAD(P)H: quinone oxidoreductase 1, GCLC Glutamate-cysteine ligase.
Fig. 2
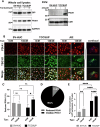
Fig. 2. Cancer cells mediate PDIA1 homeostasis through EV release.
A Western blot showing PDIA1 levels in whole cell lysates and EVs derived from non-transformed SV-HUC and TCCSUP cancer cells with tunicamycin (140 nM Tun; in DMSO) or vehicle control (DMSO) treatment. CD9 was used as an EV marker and normalization control for EV proteins. B Immunofluorescence staining demonstrating PDIA1 and TSG101 intensity and cellular localization in SV-HUC, TCCSUP, and J82 cancer cells with tunicamycin (140 nM Tun) or vehicle (0 nM Tun) treatment. Scale bars: 10 µm. C The percentage of reduced PDIA1 in TCCSUP cancer cells (left) or SV-HUC non-transformed cells (right) with tunicamycin (140 nM Tun) or vehicle (0 nM Tun) treatment as shown by reduced thiol quantification. D Percentage of reduced and oxidized PDIA1 in TCCSUP EVs as estimated by reduced thiol quantification. E EV release kinetics for SV-HUC and TCCSUP cells following tunicamycin (140 nM Tun) or vehicle (0 nM Tun) treatment for 36 h. For (C) and (E), two-way ANOVAs were performed with Fisher’s LSD multiple comparison test; for (C), n = 3, and for (E), n = 9; error bars indicate means ± standard deviation. *p < 0.05, **p < 0.01, ***p < 0.001, ****p < 0.0001. EV extracellular vesicle, PDIA1 protein disulfide isomerase A1, CD9 cluster of differentiation 9, TSG101 tumor susceptibility gene 101, ANOVA analysis of variance, DMSO dimethyl sulfoxide, Tun tunicamycin.
Fig. 3
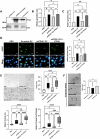
Fig. 3. PDIA1-enriched BC-derived EVs induce ROS, DNA damage, and colony formation in recipient urothelial cells.
A Western blotting analysis of PDIA1 abundance in EVs derived from scramble control and PDIA1-targeting lentiviral shRNA-transduced TCCSUP cells. GAPDH was selected as a normalization control for cell lysates, while CD63 was used as an EV marker and normalization control for EV proteins. B ROS levels in SV-HUC cells following a 24-hour treatment with scramble control, shPDIA1 TCCSUP EVs, or SV-HUC control EVs, as analyzed by DCFDA and flow cytometry assays. Data represent the fold change in the DCFDA histogram geometric mean relative to the PBS control. C Representative images and quantification of DNA double-strand break in SV-HUC cells following an 18-hour treatment with scramble control or shPDIA1 TCCSUP EVs, as assessed by γH2AX immunofluorescence staining. Scale bars: 10 µm. D Representative images and quantification of the number of colonies in soft agar formed by SV-HUC cells following a 13-week treatment with scramble control or shPDIA1 TCCSUP EVs and 5 weeks of regular culture for stabilization. For (B), (C), and (D), one-way ANOVAs were performed with Tukey’s multiple comparison test; n = 4 or 5; error bars indicate means ± standard deviation. *p < 0.05, **p < 0.01, ***p < 0.001, ****p < 0.0001. EV extracellular vesicle, PDIA1 protein disulfide isomerase A1, shPDIA1 short hairpin RNA targeting PDIA1, PERK Protein Kinase RNA-Like ER Kinase, DCFDA 2’,7’-dichlorofluorescein diacetate, PBS phosphate-buffered saline, ANOVA analysis of variance, γH2AX γ histone 2a family member X, WCL whole cell lysate, CD63 cluster of differentiation 63.
Fig. 4
Fig. 4. Restoration of PDIA1 to shPDIA1 EVs rescues their ability to increase cellular stress and anchorage-independent growth.
A Western blot showing PDIA1 levels in TCCSUP EVs following extrusion with recombinant PDIA1. CD9 was used as an EV marker and normalization control for EV proteins. B ROS level in SV-HUC cells following treatment with EVs derived from scramble TCCSUP control cells, or from shPDIA1 TCCSUP EVs extruded with rPDIA1 or PBS control, as analyzed via DCFDA and flow cytometry assays. Data represent the fold change in the DCFDA histogram geometric mean relative to PBS control. C NFE2L2 gene expression in SV-HUC cells treated with EVs derived from scramble TCCSUP control cells, or from shPDIA1 TCCSUP EVs extruded with rPDIA1 or PBS control. D Representative images and quantification of DNA damage in SV-HUC cells following an 18-hour treatment with EVs derived from scramble TCCSUP control cells or from shPDIA1 TCCSUP EVs extruded with rPDIA1 or PBS control, as assessed by γH2AX immunofluorescence staining. Scale bars: 10 µm. E Representative images and quantification of the number of colonies (top right panel), percent colony area normalized to that in PBS-treated control (bottom left panel), and the product of percent colony area and corresponding intensitites normalized to that in PBS-treated control (bottom right panel) in soft agar formed by SV-HUC cells following a 13-week treatment with EVs derived from scramble TCCSUP control cells, or from shPDIA1 TCCSUP EVs extruded with rPDIA1 or PBS control. The number of colonies was obtained with the Colony Counter plugin of ImageJ whereas the percent colony area and their intensities were derived using the ColonyArea plugin of ImageJ. F Representative images and quantification of the colonies in soft agar formed by transformed SV-HUC established by long-term cancer EV stimulation (parental), and by transformed SV-HUC transduced with scramble control (scramble) and PDIA1-targeting lentiviral shRNA (shPDIA1). For (BE), one-way ANOVAs were performed with Fisher’s LSD multiple comparison test; n = 4, 3, 5, and 7, respectively; error bars indicate means ± standard deviation. *p < 0.05, **p < 0.01, ***p < 0.001, ****p < 0.0001. EV extracellular vesicle, PDIA1 protein disulfide isomerase A1, shPDIA1 short hairpin RNA targeting PDIA1, rPDIA1 recombinant PDIA1, NFE2L2 NF-E2-Related Factor 2, DCFDA 2’,7’-dichlorofluorescein diacetate, PBS phosphate-buffered saline, ANOVA analysis of variance, γH2AX γ histone 2a family member X, CD9 cluster of differnetiation 9.
Fig. 5
Fig. 5. High levels of PDIA1 expression in non-muscle invasive bladder cancer patient tumor tissue predicts a higher risk of recurrence.
A Intensity of BiP (left) and PDIA1 (right) immunofluorescence staining. Each dot represents the average values of a patient. B Representative images of tumor tissue derived from patients with non-recurrent (left) and recurrent (right) NMIBC. PDIA1, BiP, and cell nuclei are respectively stained in green, red, and blue. Scale bars: 40 µm. C Area (left) and fluorescence signal intensity (right) of PDIA1 in BiP negative regions. D Recurrence-free survival rates for patients with corresponding PDIA1 (left) or BiP (right) expression. For (A) and (C), two-tailed Mann-Whitney U tests was performed; n = 42 (non-recurrent) or 63 (recurrent). For (D), patients were categorized into BiP- and PDIA1-high and -low categories based on the corresponding median values. Since there were censored observations, log-rank test was performed. *p < 0.05, **p < 0.01, ***p < 0.001, ****p < 0.0001. BiP binding immunoglobulin protein, PDIA1 protein disulfide isomerase A1, NMIBC non-muscle-invasive bladder cancer, ANOVA analysis of variance.
Fig. 6
Fig. 6. A proposed model of the role of PDIA1 and PDIA1-enriched EVs in bladder cancer cell survival and disease recurrence.
Within both and non-transformed cells, PDIA1 transitions between oxidized (PDIA1oxi) and reduced (PDIA1red) states as it catalyzes disulfide bond formation and isomerization for misfolded and unfolded proteins in the ER. This activity is engaged at elevated levels under conditions of ER stress that arise in bladder cancer cells, triggering the generation of large quantities of H2O2 as a byproduct of this process. Tumor cells release large quantities of primarily oxidized PDIA1 in their EVs, mitigating this oxidative stress in a manner conducive to cell survival. These bladder tumor cell-derived EVs, in turn, can deliver PDIA1 to recipient non-transformed urothelial cells, wherein it can generate elevated levels of H2O2 that, over time, triggers DNA damage contributing to a higher risk of malignant transformation that may contribute to the development of recurrent lesions.

Similar articles

References

    1. Messing EM, Madeb R, Young T, Gilchrist KW, Bram L, Greenberg EB, et al. Long-term outcome of hematuria home screening for bladder cancer in men. Cancer. 2006;107:2173–9. - PubMed
    1. Scosyrev E, Noyes K, Feng C, Messing E. Sex and racial differences in bladder cancer presentation and mortality in the US. Cancer. 2009;115:68–74. - PubMed
    1. Brandau S, Suttmann H. Thirty years of BCG immunotherapy for non-muscle invasive bladder cancer: a success story with room for improvement. Biomedicine Pharmacother = Biomedecine Pharmacotherapie. 2007;61:299–305. - PubMed
    1. Czerniak B, Dinney C, McConkey D. Origins of bladder cancer. Annu Rev Pathol. 2016;11:149–74. - PubMed
    1. Jones TD, Wang M, Eble JN, MacLennan GT, Lopez-Beltran A, Zhang S, et al. Molecular evidence supporting field effect in urothelial carcinogenesis. Clin Cancer Res. 2005;11:6512–9. - PubMed

MeSH terms

Substances