. 2025 Apr 11;15(1):12390.
doi: 10.1038/s41598-025-97604-0.

The role of hypoxia-senescence co-related molecular subtypes and prognostic characteristics in hepatocellular carcinoma

Affiliations

The role of hypoxia-senescence co-related molecular subtypes and prognostic characteristics in hepatocellular carcinoma

Fuqing Chen et al. Sci Rep. .

Abstract

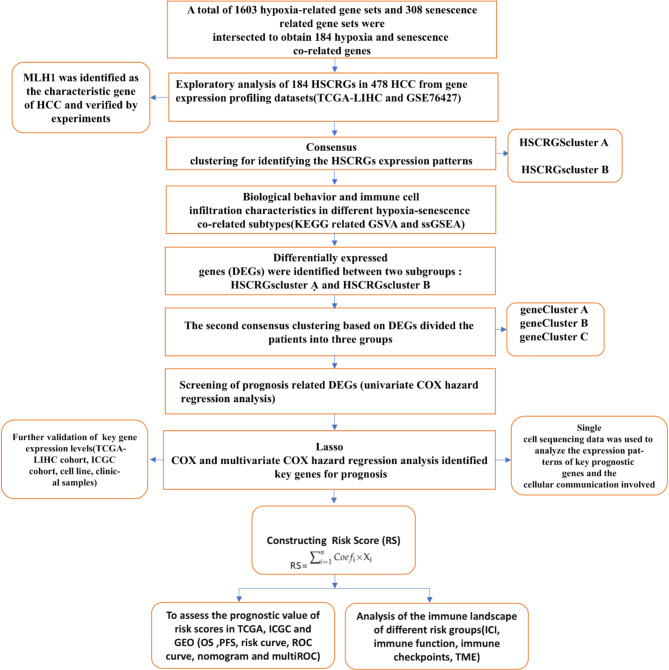
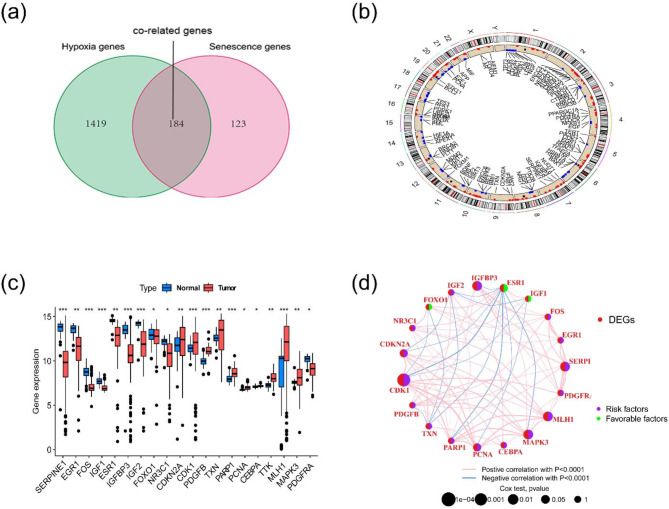
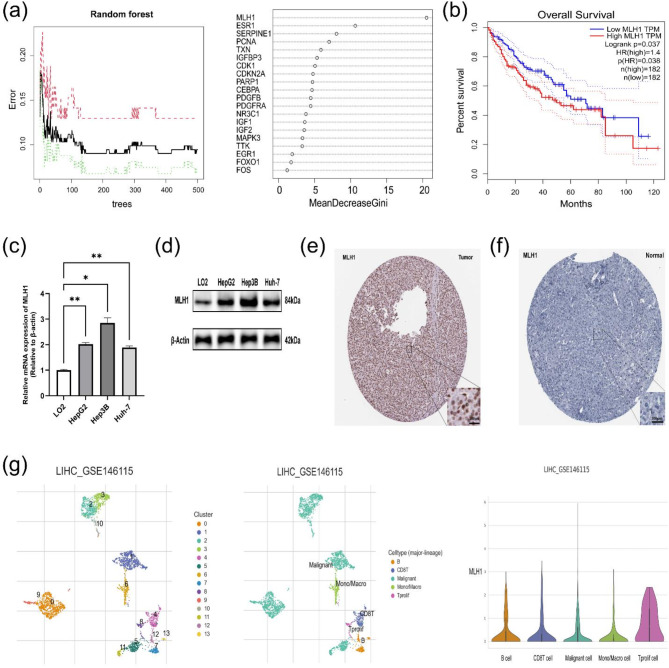
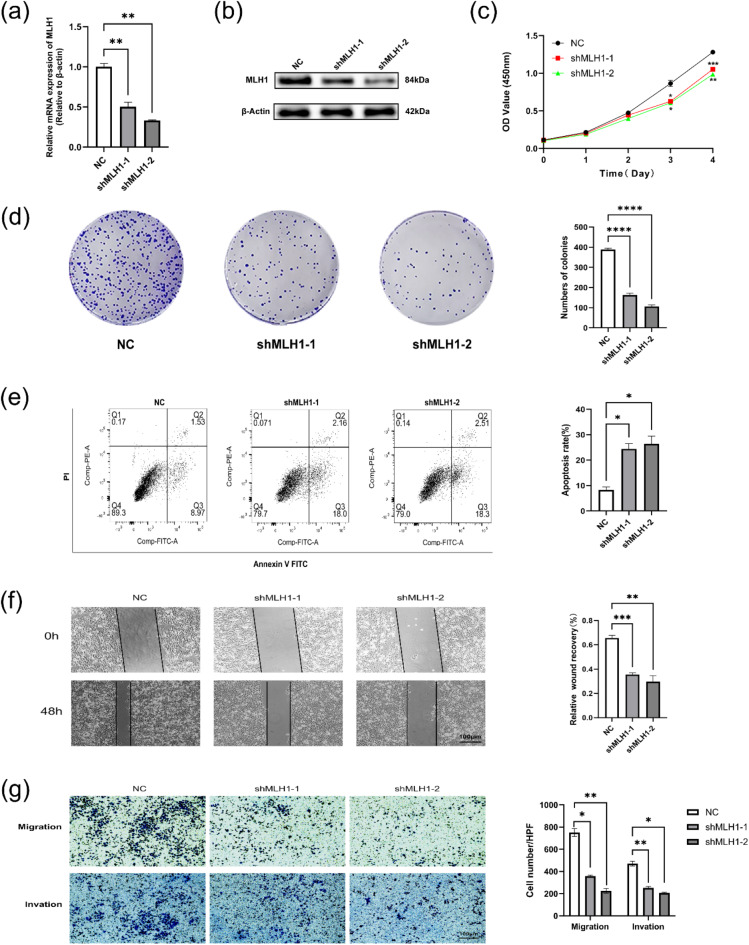
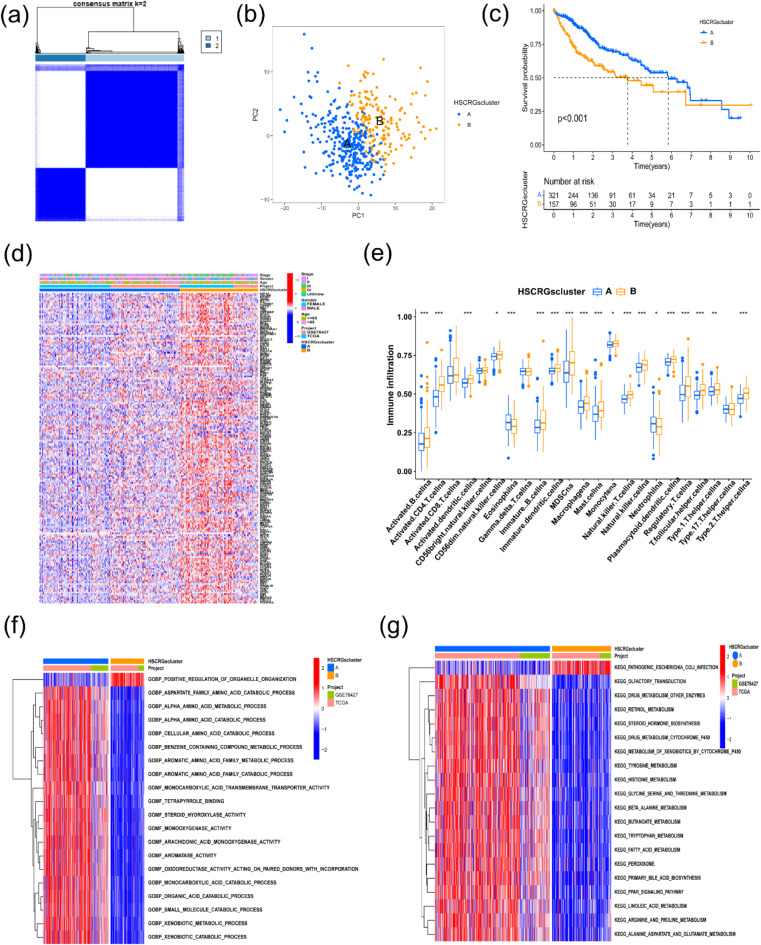
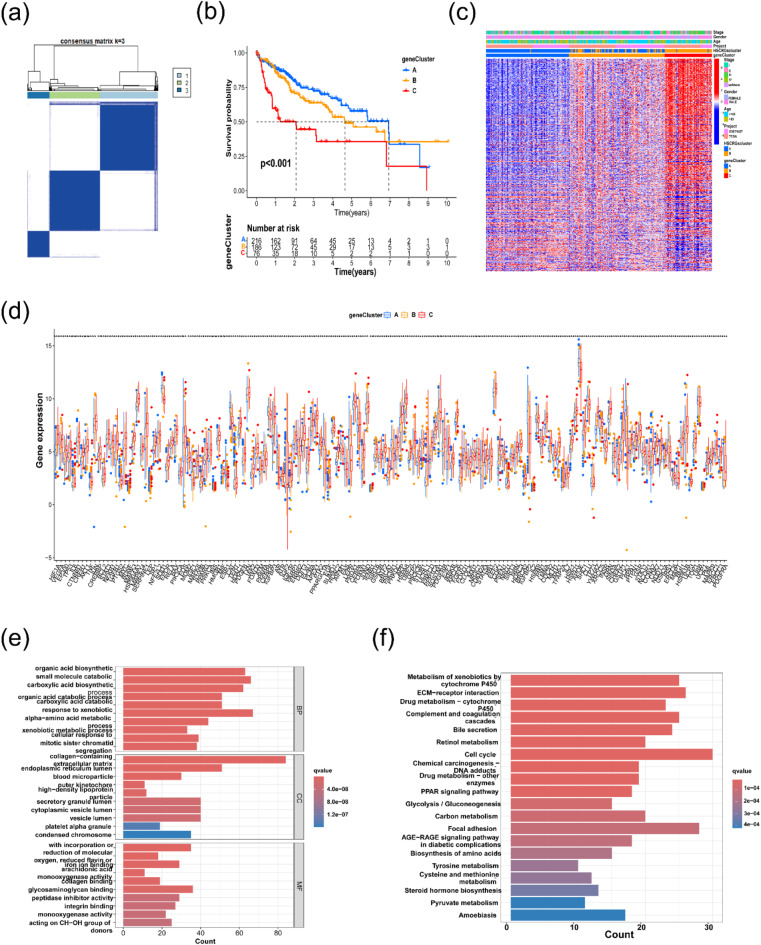
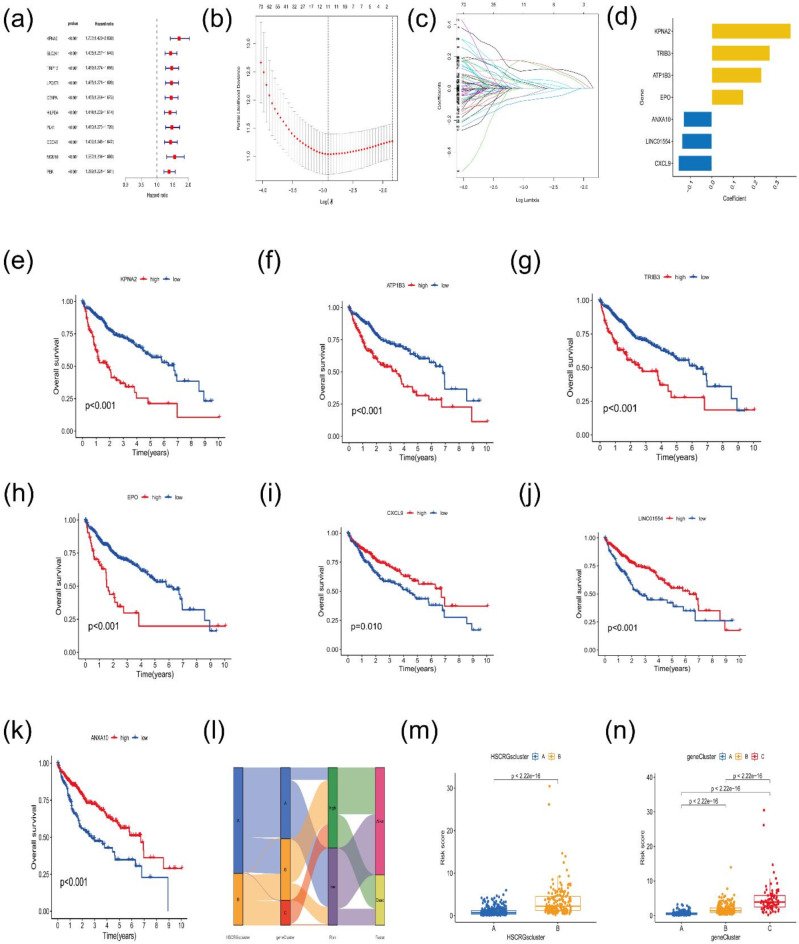
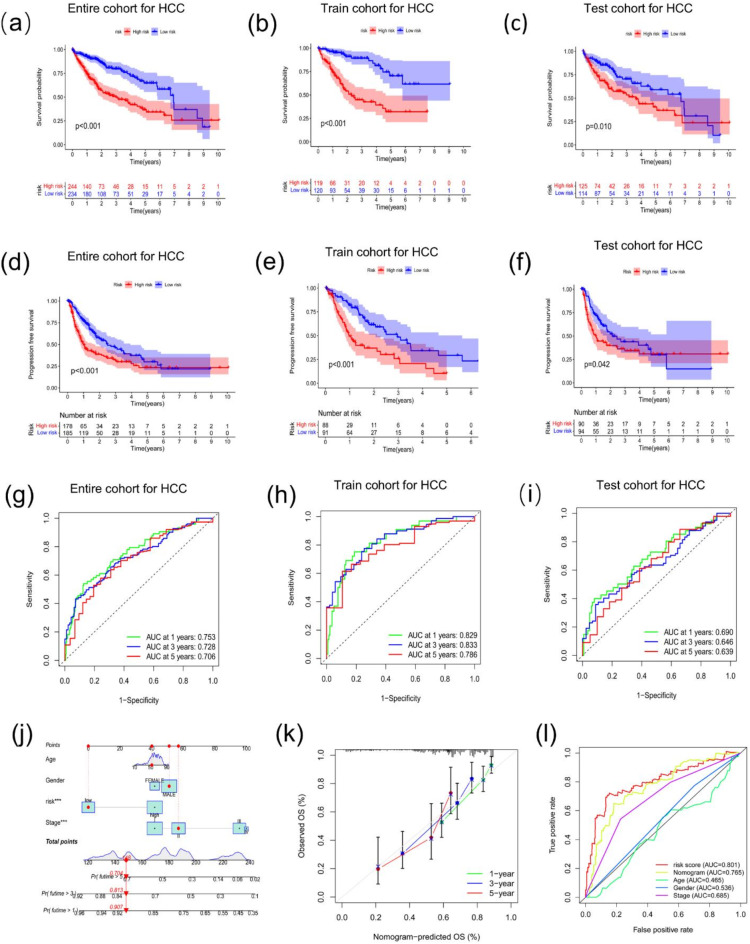
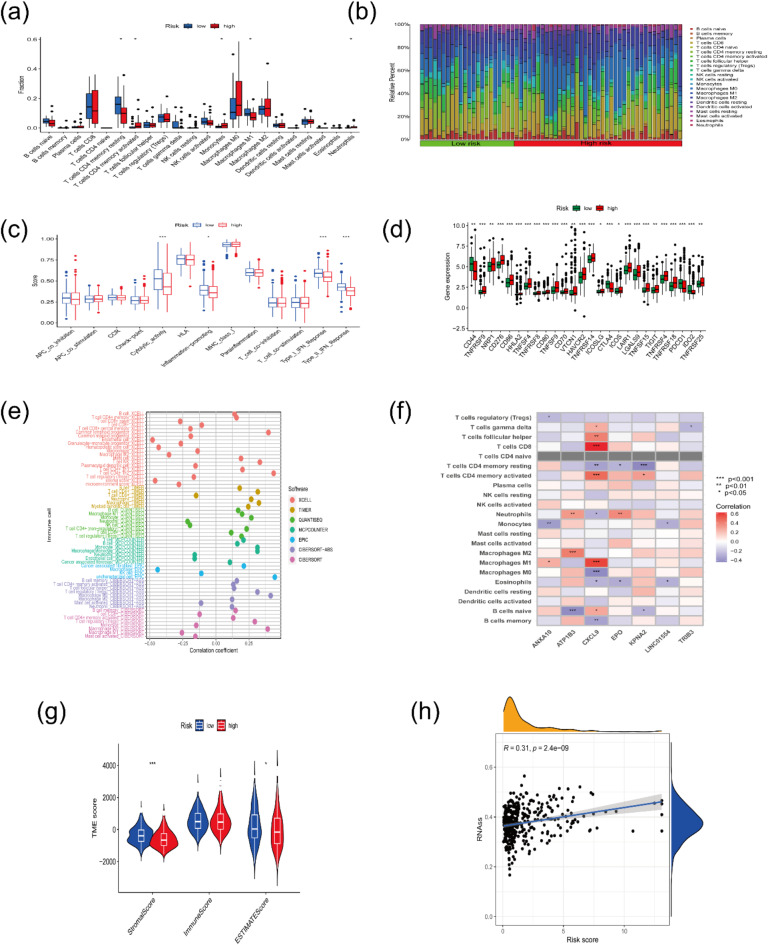
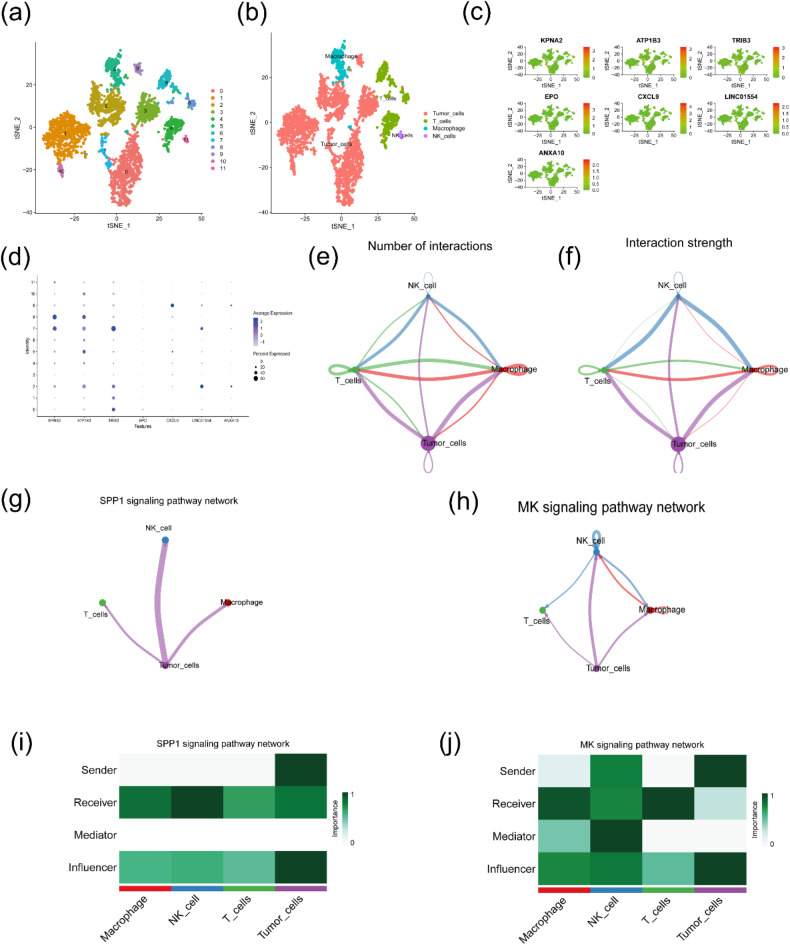
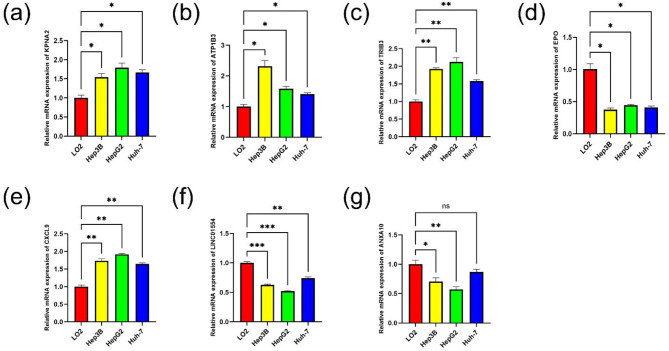
Hepatocellular carcinoma (HCC) is known for its high invasiveness, high fatality rate. Both hypoxia and senescence play crucial roles in the initiation and progression of cancer, yet their prognostic implications in HCC are yet to be fully understood. The hypoxia-senescence co-related genes (HSCRGs) were screened from public databases. Transcriptome data and clinical information were obtained from patients with HCC using the Cancer Genome Atlas, GSE76427, and International Cancer Genome Consortium (ICGC). The random forest tree algorithm was used to identify the characteristic genes of the disease, and the genes were verified by related experiments. SVM algorithm was used to classify HCC patients based on HSCRGs. The prediction model based on HSCRGs was established by LASSO, univariate and multivariate COX regression analysis. We used the ICGC for outside validation. The risk score model was analyzed from subgroup analysis, immune infiltration, and functional strength. The expression patterns of key prognostic genes in tumor microenvironment were decoded by single cell analysis. A total of 184 HSCRGs were identified. The expression pattern and functional characteristics of MLH1 gene in HCC were verified. Two HCC subtypes were identified based on HSCRGs. Then, a prediction model based on HSCRGs was established, and risk score was identified as an independent prognostic indicator of HCC. A new nomogram is constructed and shows good prediction ability. We further determined that the level of infiltration of immune cells and the expression of immune checkpoints are significantly affected by the risk score. The immune microenvironment was different between the two risk groups. The high-risk group was dominated by immunosuppressed cells, and the prognosis was poor. Single-cell analysis revealed the expression of seven key prognostic genes in the tumor microenvironment. Finally, qPCR results further verified the expression levels of seven prognostic genes. HSCRGs are of great significance in the prognosis prediction, risk stratification and targeted therapy of patients with HCC.

Keywords: Hepatocellular carcinoma; Hypoxia; MLH1; Molecular subtypes; Prognostic risk model; Senescence.


Conflict of interest statement

Declarations. Competing interests: The authors declare no competing interests.

Figures

Fig. 1
Fig. 1
The flowchart of the entire study.
Fig. 2
Fig. 2
(a) A total of 184 HSCRGs. (b) The location of CNV alterations of HSCRGs on different chromosomes. (c) The expression of different HSCRGs between normal and tumor tissues. (d) Prognostic network diagram of DEGs in HCC. The circle size represents the range of significance values of each DEG on the prognosis. The p-values were calculated by log-rank test. Green dots represent favorable factors for prognosis, and purple dots represent risk factors for prognosis. The lines linking DEGs represent their correlation. The thickness of the lines represents the strength of correlation between DEGs. Negative and positive correlations were marked with blue and red, respectively. HSCRGs, hypoxia-senescence co-related genes; CNV, copy number variation; HCC, hepatocellular carcinoma; DEGs, differentially expressed genes. *p < 0.05; **p < 0.01; ***p < 0.001.
Fig. 3
Fig. 3
(a) Random forests identifying key genes for disease. (b) Kaplan–Meier curves showed overall survival difference between high and low MLH1 expression groups in the TCGA-LIHC cohort (p = 0.037). (c, d) Real time-PCR and Western blot revealed that the expression of MLH1 was notably increased in HCC cell lines. (e, f) Immunohistochemical staining of MLH1 in tumor tissues and normal tissues of HCC patients in the HPA database (100 ×). (g) Expression pattern of MLH1 in the tumor microenvironment by single cell analysis. HCC, hepatocellular carcinoma; HPA, Human Protein Atlas.*p < 0.05, ** p < 0.01.
Fig. 4
Fig. 4
(a, b) The knockdown levels of MLH1 in Hep 3B cell line were detected by qPCR and western blot. β-actin was used as internal parameter. (c) Cell proliferation capacity was determined by CCK-8 analysis after knockdown of MLH1 in Hep 3B cells. (d) Effect of inhibition of MLH1 expression on colony formation of Hep 3B cells. (e) Effect of inhibition of MLH1 gene expression on apoptosis of Hep 3B cells (f) Wound healing assays revealed that knockdown MLH1 notably inhibited migration ability of Hep 3B cells (100 ×). (g) Transwell assays revealed that knockdown MLH1 notably inhibited migration and invasion of Hep 3B cells (100 ×). *p < 0.05, **p < 0.01, ***p < 0.001, ****p < 0.0001.
Fig. 5
Fig. 5
(a) The consensus matrixes for all HCC samples displayed the clustering stability with 1000 iterations. All samples were clustered into an appropriate number of subtypes (k = 2). (b) Principal component analysis of the two subgroups. (c) Kaplan–Meier curves showed the overall survival difference between HSCRGscluster A and B (p < 0.001). (d) The heatmap demonstrates the expression of HSCRGs in different HSCRGsclusters. Heatmap colors indicate relative HSCRGs expression levels. (e) The abundance of each immune cell infiltration in HSCRGscluster A and B. (f, g) GO and KEGG related GSVA showing the activation status of biological behaviors in HSCRGscluster A and B.HCC, hepatocellular carcinoma; HSCRGs, hypoxia-senescence co-related genes; GO, Gene Ontology; KEGG, Kyoto Encyclopedia of Genes and Genomes(www.kegg.jp/kegg/kegg1.html); GSVA, gene set variation analysis. *P < 0.05, ** P < 0.01, ***P < 0.001.
Fig. 6
Fig. 6
(a) The consensus matrixes for TCGA-LIHC cohorts based on the DEGs among the 2 HSCRGs clusters. TCGA samples were clustered into an appropriate number of subtypes (k = 3). (b) Kaplan–Meier curves showed an overall survival difference between gene clusters (p < 0.001). (c)The heatmap shows the expression of the hypoxia and senescence co-related DEGs in different HSCRGs clusters and gene clusters. (d) The difference of HSCRGs expression in different gene clusters. (e, f) GO and KEGG enrichment analysis of hypoxia and senescence co-related DEGs. DEGs, differentially expressed genes; HSCRGs, hypoxia-senescence co-related genes; GO, Gene Ontology; KEGG, Kyoto Encyclopedia of Genes and Genomes(www.kegg.jp/kegg/kegg1.html). *P < 0.05, **P < 0.01, ***P < 0.001.
Fig. 7
Fig. 7
(a)The univariate Cox analysis of hypoxia-senescence co-related DEGs. (b, c) Identification of feature prognostic variables via LASSO analysis. (d) The prognosis key genes coefficient via multivariate Cox regression analysis. (ek) Survival curves of 7 key prognostic genes (p < 0.001 and 0.05). (l) The Sankey diagram shows the potential relationship of risk score and clinical survival outcome in HSCRGs-clusters and gene clusters. (m, n) Difference analysis of risk score in HSCRGs-clusters and gene clusters. DEGs, differentially expressed genes; HSCRGs, hypoxia-senescence co-related genes (p < 0.001).
Fig. 8
Fig. 8
(ac) Survival differences between the low-risk group and the high-risk group in the entire cohort, training cohort, and test cohort (p < 0.001 and 0.05). (df) PFS between low-risk group and high-risk group in the entire, training and test cohorts (p < 0.001 and 0.05). (gi) ROC curves at 1, 3, and 5 years in the entire cohort, training cohort, and test cohort. (j) Predictive nomogram based on the risk score and other clinical features. (k) Calibration curves at 1, 3, and 5 years. (l) ROC curves for clinical parameters, risk score and nomogram in the entire cohort. PFS, Progression-free survival; ROC, receiver operating characteristic curve.
Fig. 9
Fig. 9
(a) Estimation of 22 immune infiltrating cells between the low-risk group and the high-risk group by CIBERSOR. (b) Proportion of 22 immune infiltrating cells for each HCC sample by CIBERSOR. (c) Estimation of immune activities between the low-risk group and the high-risk group by ssGSEA. (d) The expression pattern of immune checkpoints between the low-risk group and the high-risk group. (e) Different software analyzed the correlation of immune cells with risk scores. (f) Correlations between 7 key genes and 22 immune infiltrating cells. (g) Differences in stromal, immune, and ESTIMATE scores in the two different risk groups. (h) The relationship between risk score and RNAss. HCC, hepatocellular carcinoma; ssGSEA, Single sample gene set enrichment analysis; RNAss, RNA stemness score.
Fig. 10
Fig. 10
(a, b) Identification of cell subgroups in the tumor microenvironment of hepatocellular carcinoma. (c, d) Expression pattern of the seven key genes in the tumor microenvironment. (e, f) Diagrams displaying the interaction number and strength in cell clusters. (g,h) associated with malignant cell subpopulation and their cell communication networks. The thicker the line represented, the more the number of interactions, and the stronger the interaction strength between the two cell types. (i,j) Primary originators and influencers of key signaling pathways.
Fig. 11
Fig. 11
(ag) The mRNA levels of the seven prognostic key genes in normal hepatocellular cell line and hepatocellular carcinoma cell lines (benign cell: LO2; malignant cells: Hep3B, HepG2, and Huh-7). *P < 0.05, **P < 0.01, ***P < 0.001, ns, non-significant.

Similar articles

References

    1. Sung, H. et al. Global cancer statistics 2020: GLOBOCAN estimates of incidence and mortality worldwide for 36 cancers in 185 countries. CA Cancer J. Clin.71, 209–249. 10.3322/caac.21660 (2021). - PubMed
    1. Ali, N. A., Hamdy, N. M., Gibriel, A. A. & El Mesallamy, H. O. Investigation of the relationship between CTLA4 and the tumor suppressor RASSF1A and the possible mediating role of STAT4 in a cohort of Egyptian patients infected with hepatitis C virus with and without hepatocellular carcinoma. Arch. Virol.166, 1643–1651. 10.1007/s00705-021-04981-8 (2021). - PubMed
    1. Llovet, J. M. et al. Hepatocellular carcinoma. Nat. Rev. Dis. Primers7, 6. 10.1038/s41572-020-00240-3 (2021). - PubMed
    1. Youssef, S. S. & Hamdy, N. M. SOCS1 and pattern recognition receptors: TLR9 and RIG-I; novel haplotype associations in Egyptian fibrotic/cirrhotic patients with HCV genotype 4. Arch. Virol.162, 3347–3354. 10.1007/s00705-017-3498-7 (2017). - PubMed
    1. Elanany, M. M., Mostafa, D. & Hamdy, N. M. Remodeled tumor immune microenvironment (TIME) parade via natural killer cells reprogramming in breast cancer. Life Sci.330, 121997. 10.1016/j.lfs.2023.121997 (2023). - PubMed

Substances

LinkOut - more resources