. 2025 May;5(5):868-882.
doi: 10.1038/s43587-025-00851-z. Epub 2025 Apr 11.

Pre-symptomatic Parkinson's disease blood test quantifying repetitive sequence motifs in transfer RNA fragments

Affiliations

Pre-symptomatic Parkinson's disease blood test quantifying repetitive sequence motifs in transfer RNA fragments

Nimrod Madrer et al. Nat Aging. 2025 May.

Abstract

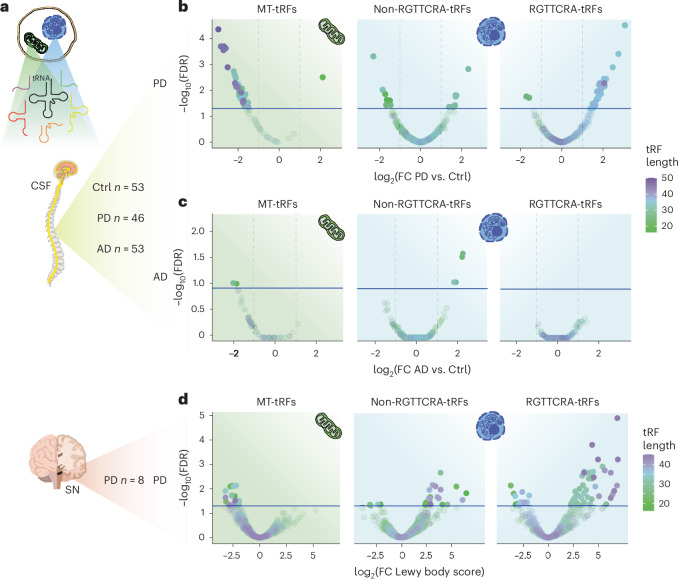
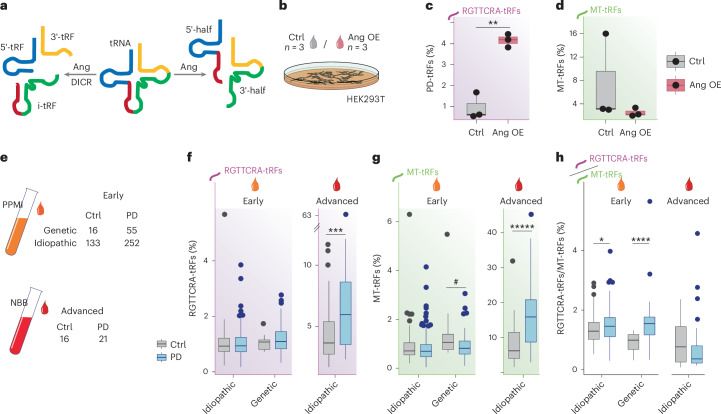
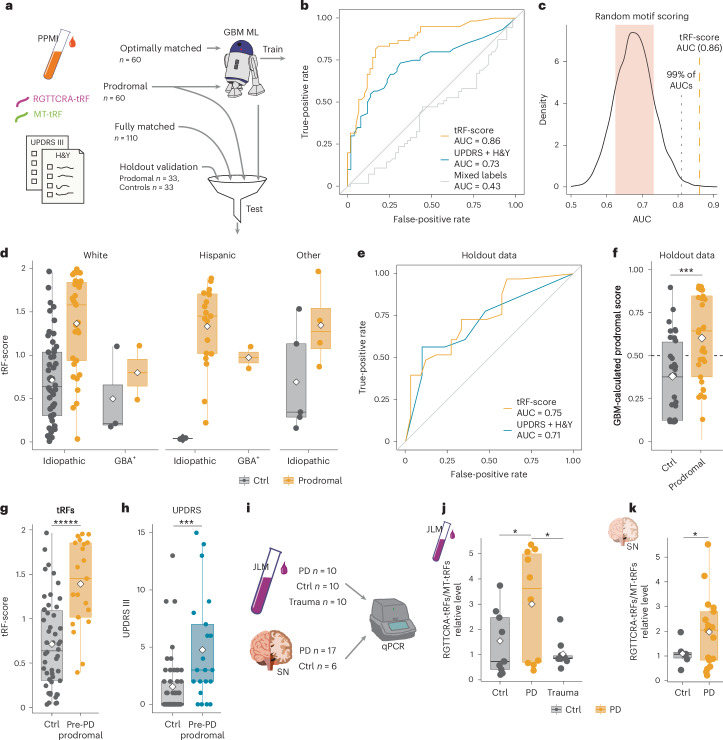
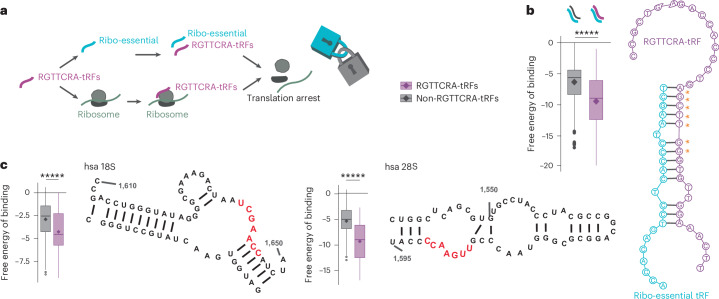
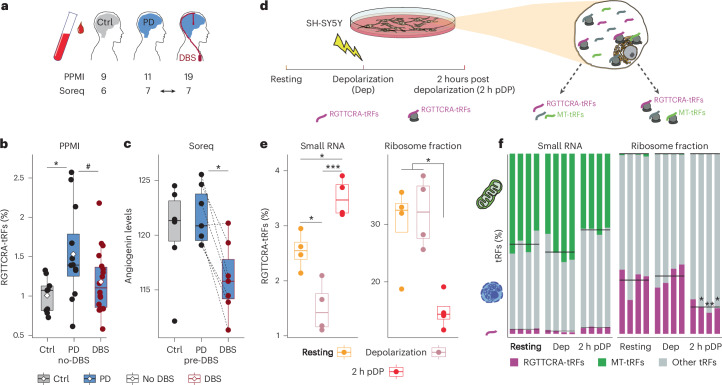
Early, efficient Parkinson's disease (PD) tests may facilitate pre-symptomatic diagnosis and disease-modifying therapies. Here we report elevated levels of PD-specific transfer RNA fragments carrying a conserved sequence motif (RGTTCRA-tRFs) in the substantia nigra, cerebrospinal fluid and blood of patients with PD. A whole blood qPCR test detecting elevated RGTTCRA-tRFs and reduced mitochondrial-originated tRFs (MT-tRFs) segregated pre-symptomatic patients with PD from controls (area under the receiver operating characteristic curve (ROC-AUC) of 0.75 versus 0.71 based on traditional clinical scoring). Strengthening PD relevance, patients carrying PD-related mutations presented higher blood RGTTCRA-tRFs/MT-tRFs ratios than mutation-carrying non-symptomatic controls, and RGTTCRA-tRF levels decreased in patients' blood after deep brain stimulation. Furthermore, RGTTCRA-tRFs complementarity to ribosomal RNA and the translation-supporting LeuCAG3-tRF might aggravate PD via translational inhibition, as reflected by disrupted ribosomal association of RGTTCRA-tRFs in depolarized neuroblastoma cells. Our findings show tRF involvement in PD and suggest a potential simple and safe blood test that may aid clinicians in pre-symptomatic PD diagnosis after validation in larger independent cohorts.


Conflict of interest statement

Competing interests: H.S., N.M., E.L. and S.V.-T. have patents listed on the finding of the PD motif sequence: application 63/531,628, titled ‘Methods for detection, qualification, or monitoring of Parkinson’s disease’, and application number 63/557,661, titled ‘Angiogenin-reducing agents for treating Parkinson’s disease’. H.S. serves as the senior academic advisor to the Azrieli Fellows Program in Israel. The other authors declare no competing interests.

Figures

Fig. 1
Fig. 1. Nuclear-originated RGTTCRA-tRFs are elevated and MT-tRFs decrease in the CSF and SN of patients with PD.
a, Schematic representation of N-tRFs and MT-tRFs in PM CSF and SN samples. b, Levels of MT-tRFs (left; green background) and N-tRFs containing and lacking the RGTTCRA motif (right and middle; blue background) in PD CSF. Each dot represents a tRF. x: log2(fold change (FC)) of PD versus Ctrl levels. y: −log10(FDR-adjusted P value). Horizontal blue line: FDR = 0.05. Vertical dashed lines: log2(FC) > 1 or log2(FC) < −1. Dot colors: tRF lengths. c, As described in b for AD versus Ctrl. d, MT-tRFs decrease and elevation of RGTTCRA-tRFs associates with Lewy body scores in the SN. x axis: log2(FC) for high versus low Lewy body score (that is, prevalence and localization of brain Lewy bodies). y axis: −log10(FDR-adjusted P values). Colors are as in b.
Fig. 2
Fig. 2. Ang overexpression elevates RGTTCRA-tRFs, and RGTTCRA-tRFs/MT-tRFs ratio segregates early PD patients from controls.
a, Scheme of tRNA cleavage by Ang and Dicer. b, tRFs were quantified in Ctrl and Ang-overexpressing (OE) HEK293T cells. c,d, RGTTCRA-tRF (c, purple) and MT-tRF (d, green) percentages in Ang-OE versus Ctrl. Each dot represents a biological replicate (n = 3 in each condition). **P < 0.0093 and P < 0.375 for c and d, respectively, two-sided t-test, FDR correction. e, Numbers of blood samples from live controls and early PD patients with and without PD-related mutations (PPMI) and PM advanced PD patients (NBB). f,g, Percentage of RGTTCRA-tRFs (f, purple) and MT-tRFs (g, green) in Ctrl and PD samples (PPMI, ‘Early’; Idiopathic, carrying no PD-related mutations; Genetic, carrying LRRK2, GBA or SNCA mutations; NBB, ‘Advanced’). Each dot represents a patient (n = 133, 252, 16, 55, 16 and 21; from leftmost box plot to rightmost one). For RGTTCRA-tRFs and MT-tRFs in advanced patients: ***P < 0.00015 and *****P < 8 × 10−11, respectively, two-way ANOVA. For MT-tRFs in early Genetic patients: #P < 0.057, two-sided Mann–Whitney test, FDR correction. h, RGTTCRA-tRFs/MT-tRFs ratio in the above six groups. *P < 0.02 and ****P < 0.00044 for early Idiopathic and Genetic patients, respectively, and P < 0.0013 for PD versus Ctrl in all groups. Two-way ANOVA. All box plots in this figure are defined so that the central line of the box plot represents the median; the lower and upper box bounds represent 0.25 and 0.75 quantiles; and lower and upper whisker bounds represent 0 and 1 quantiles.
Fig. 3
Fig. 3. Blood RGTTCRA-tRFs/MT-tRFs ratio segregates prodromal and PD patients from healthy controls.
a, GBM machine learning (ML) algorithm segregated PPMI prodromal patients from controls using the ratio between RGTTCRA-tRFs (GGTCCCTGGTTCAA sequence) and MT-tRFs (TAACTTAGCATTAACCTTTTAA sequence), compared to clinical measurements. b, ROC of optimally matched prodromal patients and controls (n = 60 of each), using tRF-score (orange) or clinical UPDRS and H&Y measurements (turquoise) and mixed labels combining tRFs and clinical measurements (gray). c, Density plot of AUCs from 10,000 training events, each using a different pair of random 14-nt and 22-nt motifs (without RGTTCRA motif) to calculate ‘tRF-score’ and GBM-based AUCs. Red area: s.d. d, tRF-score in control (gray) and prodromal patients (orange) of different ethnic and genetic backgrounds. Dots represent patients. Prodromal versus Ctrl P < 2 × 10−10, two-way ANOVA. e, As in b for a holdout validation sample (33 prodromal and 33 Ctrl). f, GBM algorithm trained in b applied to holdout validation sample (n = 33 in each group). x: true classification. y: GBM-based prediction of prodromal patient diagnosis. ***P < 0.0004, two-sided t-test. g, tRF-score in control (gray) and 21 prodromal patients, later diagnosed as PD (orange). *****P < 1.1 × 10−5, two-sided t-test, FDR. h, As in f for UPDRS scores. ***P < 7 × 10−3, two-sided t-test, FDR. i, Cohorts used for the qPCR test. j, RGTTCRA/MT-tRF qPCR-based separation in fresh blood samples of PD or trauma patients and controls (10 of each). PD versus Ctrl: *P < 0.05, PD versus trauma: *P < 0.013, Dunnett test. k, As in i using 23 SN samples from the NIH NeuroBioBank. *P < 0.0452, two-sided t-test. All box plots in this figure are defined so that the central line of the box plot represents the median; the lower and upper box bounds represent 0.25 and 0.75 quantiles; and lower and upper whisker bounds represent 0 and 1 quantiles.
Fig. 4
Fig. 4. RGTTCRA-tRFs may co-hybridize with a ribosome-essential tRF and rRNAs.
a, RGTTCRA-tRFs (purple) can hybridize both with a ribosome-essential tRF (Ribo-essential, cyan) and with 18S and 28S rRNAs, producing a ‘dual-lock’ translational arrest. b, Left, total binding energy of the Ribo-essential tRF to all CSF tRFs lacking (gray) or carrying (purple) the RGTTCRA motif (n = 1,017 tRFs). *****P < 1 × 10−30, two-sided t-test. Right, predicted interaction between a RGTTCRA-tRF (purple) and the Ribo-essential tRF (cyan) with PD motif nucleotides marked (orange asterisks). c, Left, total binding energy of 18S and 28S regions carrying RGTTCRA motif-complementary sequences to all CSF tRFs lacking (gray) or carrying (purple) the RGTTCRA PD motif. *****P < 2 × 10−25, *****P < 3 × 10−67, two-sided t-test, FDR. Right, secondary structures of 18S and 28S rRNA showing RGTTCRA motif-complementary sequences (red). All box plots in this figure are defined so that the central line of the box plot represents the median; the lower and upper box bounds represent 0.25 and 0.75 quantiles; and lower and upper whisker bounds represent 0 and 1 quantiles.
Fig. 5
Fig. 5. RGTTCRA-tRFs decreased in the blood of DBS-treated patients with PD and in ribosomal fractions of depolarized neuroblastoma cells.
a, Blood was drawn from controls and patients with PD with and without DBS from the PPMI and Soreq datasets. b, RGTTCRA-tRF levels in control carriers of PD-related mutations (gray) and PD carriers of mutated LRRK2 or GBA genes (blue) with and without DBS (red and black outlines), n = 9, 11, 19. y: percentage of RGTTCRA-tRFs from total tRF counts (rhombuses indicate mean). PD versus Ctrl *P < 0.027, PD versus DBS #P < 0.095, one-way ANOVA. c, Ang levels in blood samples of controls and patients with PD before and after DBS treatment, from the Soreq dataset (GSE23676), colors as in b. Dashed lines connect pre-DBS and post-DBS samples of each patient (six Ctrl, seven PD). PD pre-DBS versus DBS *P < 0.019, one-way ANOVA. d, Small RNA-seq and ribosome-bound RNA-seq fractions of depolarized SHSY-5Y cells (GSE155727) conducted at resting, immediately after depolarization (Dep) and 2 h pDP. e, RGTTCRA-tRF (y axis) fractions in each of the cases described in d (x axis). Four biological replicates in each condition. Cytosolic small RNA: resting versus Dep *P < 0.01, resting versus 2 h pDP *P < 0.015, Dep versus 2 h pDP ***P < 0.0001; ribosome fraction: 2 h pDP versus resting *P < 0.015, 2 h pDP versus Dep *P < 0.0065; two-way ANOVA. f, Total and ribosome-bound fractions of RGTTCRA-tRFs (purple), MT-tRFs (green) and all other tRFs (gray) in whole cells (left) and ribosome-bound fractions (right). Columns: samples and black lines represent mean RGTTCRA-tRF or MT-tRF percentages in samples. Reduction in MT-tRF in cytosolic small RNA 2 h pDP, P < 0.0033, two-way ANOVA. Three samples with altered ratios of RGTTCRA-tRFs and MT-tRFs 2 h pDP in ribosomal fractions (compared to mean distribution in resting cells), *P < 0.022, **P < 0.006, *P < 0.024, chi-square, FDR. All box plots in this figure are defined so that the central line of the box plot represents the median; the lower and upper box bounds represent 0.25 and 0.75 quantiles; and lower and upper whisker bounds represent 0 and 1 quantiles.
Extended Data Fig. 1
Extended Data Fig. 1. Technical representation of the datasets and methods.
a. The different datasets used in this work with total number of samples in each. All datasets were subjected to files quality check (using FASTQC), adaptor removal (FLEXBAR) and alignment to tRFs (MINTmap). b. DE analysis using EdgeR was applied on CSF (PD vs. Ctrl) and SN (high vs. low Lewy body score) samples. c. The consensus motif sequence identified by the MEME tool. Letters heights: Nucleotides conservation among upregulated N-tRFs. d. PPMI samples were further divided to subgroups according to the relevant comparison, with prodromal PD patients (n = 189) divided to 60 + 60 optimally matched patients and controls, 33 + 33 optimally matched test data, and 60 + 110 fully matched patients and controls. e, f. Calculated sum (E) and percentage (F) for RGTTCRA-tRFs and MT-tRFs (and their ratio – RGTTCRA-tRFs/MT-tRFs) from all blood samples. g. Normalized calculated PD/MT-tRFs ratio for the two prodromal groups. h. The optimally matched patients served as a training dataset (GBM, k = 5 folds). i. Naïve test data and Fully matched patients served as a testing dataset. j. Blood samples collected in Jerusalem and SN samples obtained from the NIH NeuroBioBank served to test qPCR segregation of PD from controls using the primers designed based on the PPMI prodromal data. k. Long-RNA Affymetrix data (GSE23676) served to map Angiogenin levels in 7 PD patients before and after DBS neurosurgery.
Extended Data Fig. 2
Extended Data Fig. 2. MTtRFs decline, NtRFs and RGTTCRA-tRFs elevate in both Male and Female PD patients vs. controls.
a. Density plots of post-mortem interval in female and male samples (left, right) and patients’ age (upper and lower panel). Note that PD, but not AD appears to shorten patients’ life span. b, c. Volcano plots for male (A) and Female (B) CSF samples. Each dot is a tRF. X: log2(Fold Change) of PD/Ctrl levels. Y: -log10(FDR adjusted p value). Horizontal and vertical lines: FDR < 0.05; log2(FC) > 1 or <-1. Left: NtRFs, right: MTtRFs. Dot colors: tRFs’ length. d. Scheme of tRNA breakdown into tRF types by Angiogenin (Ang) or Dicer (DICR). e. Segregation of PD-modified tRFs (Fig. 1b) to subtypes as in A. Each dot is a tRF. X: log2(Fold Change) of PD/Ctrl levels. Y: -log10(FDR adjusted p value). Background colors: NtRFs (blue), MTtRFs (green). f, g. Volcano plots for male (E) and Female (F) CSF samples. PD CSF NtRFs segregated into RGTTCRA-carrying and lacking tRFs. Blue thick line: FDR = 0.05. Grey line: unadjusted p = 0.05. Each dot is a tRF. X: log2(Fold Change) of PD/Ctrl levels. Y: -log10(FDR adjusted p value). Dot colors: tRFs’ length. h. As in A for 8 PD SN samples.
Extended Data Fig. 3
Extended Data Fig. 3. Overexpression but not knockout of Ang selectively affect RGTTCRA-tRF levels which also correlate to Lewy bodies score in PD blood. MT-tRNA are reduced with PD duration.
a. KO of Ang (green) in U2SO cells with or without sodium arsenite (SA) exposure (purple and grey). Y axis: percentage of RGTTCRA-tRFs out of all expressed tRFs. b. As A. for MT-tRFs percentage. Both A and B were analyzed with a two-way ANOVA test that yielded no significant results. c. SN samples of healthy controls with (grey) or without (pink) healthy-reflecting levels of TH in their SN, compared to PD patients (blue) and SWEDD-like patients (orange) from a cohort of NBB Long-RNA-seq (n = 25). Y axis: Log10 of sum of all expressed MT-tRNAs. X axis: PD duration in years. r = 0.4, p < 0.05, Spearman correlation; PD vs. Ctrl p < 0.039 two-sided Mann-Whitney test. All boxplots in this figure are defined so that the central line of the boxplot represents the median, the lower and upper box bounds represent 0.25 and 0.75 quantiles and lower and upper whiskers bounds represent 0 and 1 quantiles.
Extended Data Fig. 4
Extended Data Fig. 4. RGTTCRA/MT-tRF score separates prodromal and controls even without normalization and UPDRS.III scores show similar, yet less significant, trends to RGTTCRA/MT-tRFs scores.
a. ROC curve of the GLM algorithm classifying prodromal and control patients, based on only tRFs (tRFs-score; orange), only clinical measurements (UPDRS section III plus Hoehn and Yahr; turquoise) or Null classification (tRFs + clinical measurements albeit with mixed labels; grey). b. Ratio between RGTTCRA-tRFs to MT-tRFs in Prodromal patients (orange; n = 60) and controls (grey; n = 129) separated by their ethnicity and genetic backgrounds. Prodromal vs. Ctrl p < 5 × 10⁻⁶, two-way ANOVA c. UPDRS.III (motor) score in optimally matched Prodromal patients (orange; n = 60) and controls (grey; n = 60) separated by their ethnicity and genetic backgrounds. d. UPDRS III scores (top) and tRFs-score (bottom) for control, prodromal and PD patients according to their ethnicities and genetic backgrounds. UPDRS: Prodromal vs. Ctrl p < 0.11, PD vs. Ctrl p < 1 × 10⁻⁸, PD vs. prodromal p < 1 × 10⁻⁸, two-way ANOVA. tRFs-score: Prodromal vs. Ctrl p < 1 × 10⁻⁷, PD vs. Ctrl p < 1 × 10⁻⁴, PD vs. prodromal p < 0.043, two-way ANOVA. e. Correlation between total UPDRS scores (Y) and tRFs-score (X axis of E) in optimally matched prodromal and control patients (n = 60 of each). r = 0.27, p < 0.01; Spearman correlation, FDR correction. f. As in E for motoric (section III) UPDRS and for normalized RGTTCRA-tRF and MT-tRF levels (purple and green, X axis of F) separately. I: r = 0.19, p < 0.06; II: r = 0.245, p < 0.0163; III: r = 0.318, p < 0.004; Spearman correlation, FDR correction. g. GBM algorithm trained in Fig. 3b applied onto fully-matched prodromal and control subjects (n = 60, n = 110). X axis: true classification. Y axis: prospects to be a prodromal PD patient based on the algorithm. tRFs: p < 5 × 10⁻¹⁴, UPDRS: p < 3 × 10⁻⁷, Chi-square test, FDR correction. h. Each dot represents a prodromal patient that was later diagnosed as PD (n = 21). X axis: UPDRS score (at basal level, not at diagnosis as PD), Y axis: tRFs-score. i. Amplicons of two qPCR products (mixture of all three triplicates) were sequenced and aligned to tRFs. >50% of the reads were mapped to different tRFs (each color represents a single tRF. Note that the most prominent tRF in sample PD1 is hardly expressed in T7 and vice versa. All boxplots in this figure are defined so that the central line of the boxplot represents the median, the lower and upper box bounds represent 0.25 and 0.75 quantiles and lower and upper whiskers bounds represent 0 and 1 quantiles.
Extended Data Fig. 5
Extended Data Fig. 5. Ribosome profiling and FRET imaging suggest direct interaction of RGTTCRA-tRFs with the ribosome.
a. Interaction of motif-carrying tRFs with ribosomes based on the GSE113751 dataset of short RNA-seq from ribosomes pulldown in HeLa (red), HCT116 (green) and HEK293T (blue) cells. Cells were either untreated or starved for Arg(inine) or Leu(cine) for 3 or 6 hours. Left Y axis: Points show RGTTCRA- tRF fractions among all tRFs. Right Y axis: total number of reads per sample. Horizontal dashed line: percent RGTTCRA-tRFs among all tRFs. b. Fluorescence intensity image of RGTTCRA-tRF (green), ribosomes (RPL24, red) and their colocalization (yellow). c. FRET-sensitized fluorescence of the acceptor indicates a non-negligible amount of donor-labeled RGTTCRA-tRF and acceptor-labeled antibody-tagged RPL24 ribosomal protein found at proximities <10 nm, and hence tRF and ribosomes interact. d, e. Fluorescence lifetime image of FRET-sensitized (C) or directly excited (D) acceptor-labeled ribosomes. f. The acceptor dye labeled by an antibody tagging the ribosomal protein RPL24 presents acceptor fluorescence decay of a region of interest (green & red arrows) after direct (red) and FRET-sensitized excitation, reflected as slower fluorescence decay of FRET-sensitized compared to direct excitation events. C, D, E: ROIs with tRFs-ribosome interactions (arrows).
Extended Data Fig. 6
Extended Data Fig. 6. Two hours depolarization impairs ribosome enrichment of RGTTCRA-containing, 3′-tRFs and i-tRFs in cultured neuroblastoma cells; but MT-tRFs do not present significant changes under DBS stimuli.
a. Blood MT-tRF levels in apparently healthy control carriers of PD-related mutations (Ctrl; grey; n = 9) and in PD patients, carriers of mutations in the LRRK2 and GBA genes (PD; blue; n = 30), with and without DBS (black and red lines; n = 11, n = 19). Y axis: mean blood MT-tRFs levels (white rhombuses). No significant changes, one-way ANOVA. b. GSE155727 dataset of ribosomal profiling and short-RNA-seq from SHSY cells. Counts per million of 3′-tRFs and i-tRFs lacking our motif (green) and carrying it (purple), from ribosome associated RNA-seq (left) or bulk short RNA-seq (right) in resting cells, or in cells right after or two hours post depolarization (2 h pDP). All boxplots in this figure are defined so that the central line of the boxplot represents the median, the lower and upper box bounds represent 0.25 and 0.75 quantiles and lower and upper whiskers bounds represent 0 and 1 quantiles.

References

    1. Aarsland, D. et al. Parkinson disease-associated cognitive impairment. Nat. Rev. Dis. Primers7, 47 (2021). - PubMed
    1. Parkinson’s disease economic burden on patients, families and the federal government is $52 billion, doubling previous estimates. https://www.michaeljfox.org/publication/parkinsons-disease-economic-burd... (2019).
    1. Trist, B. G., Hare, D. J. & Double, K. L. Oxidative stress in the aging substantia nigra and the etiology of Parkinson’s disease. Aging Cell18, e13031 (2019). - PMC - PubMed
    1. Hanan, M. et al. A Parkinson’s disease CircRNAs Resource reveals a link between circSLC8A1 and oxidative stress. EMBO Mol. Med.12, e11942 (2020). - PMC - PubMed
    1. Stykel, M. G. & Ryan, S. D. Nitrosative stress in Parkinson’s disease. NPJ Parkinsons Dis.8, 104 (2022) - PMC - PubMed

LinkOut - more resources