. 2025 Apr 11;15(1):12429.
doi: 10.1038/s41598-025-97590-3.

Development of an automated plaque-counting program for the quantification of the Chikungunya virus

Affiliations

Development of an automated plaque-counting program for the quantification of the Chikungunya virus

Akino Emi et al. Sci Rep. .

Abstract

Chikungunya virus (CHIKV) induces a massive cytopathic effect (CPE) on various cell types. Therefore, the plaque assay, a CPE-based virus titration method, remains the gold standard for quantifying the infectious units of CHIKV. However, manual plaque counting is often a labor-intensive task, especially in experiments involving multiple samples. In this study, we developed plaQuest, a stand-alone plaque-counting software running on a Windows operating system, for rapid and reliable quantification of CHIKV plaques in a 24-well plate. Our evaluation experiments using the conventional CPE-based plaque assay showed that the CHIKV plaque counts provided by plaQuest strongly correlated with the plaque counts manually determined by four analysts. In addition, the CHIKV inhibition curve of mycophenolic acid (MPA) determined by plaQuest was identical to that determined by manual counting, resulting in a similar 50% inhibitory concentration of MPA. Furthermore, the automated plaque counting by plaQuest was applicable to the evaluation of inhibitors against other RNA viruses using the CPE-based and immunostain-based plaque assay, which is an alternative titration assay for non- (or less) cytopathic viruses. Thus, our study demonstrates that plaQuest is an effective option for quantifying infectious virus titers, reducing the workload of the plaque assay.


Conflict of interest statement

Declarations. Competing interests: The authors declare no competing interests.

Figures
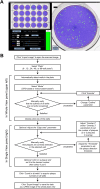
Fig. 1
Fig. 1
The plaQuest automated plaque-counting software. (A) Representative CHIKV plaque count using plaQuest software. Upon importing the 24-well plate image scanned at 1,200 dpi, the image is displayed in the upper left “Whole View” panel and the outline of each well is indicated by an orange circle. Then, by double-clicking on any well in the Whole View panel, the outline color changes to green, and the initial detection of plaques (green rectangles) in the selected well is displayed in the Single View panel on the right. After adjusting the parameters necessary for proper plaque detection (lower left), the plaque counts (green numbers) in the individual wells are displayed in the Whole View panel by clicking “Count in all wells”. The image in the Whole View panel with the count results can be saved as a JPEG file by clicking “export image”. (B) Plaque counting workflow in plaQuest.
Fig. 2
Fig. 2
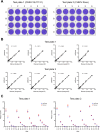
Comparison of plaQuest and manual counts in the CHIKV plaque assay. (A) Test plates used for comparison are shown. Vero cells were exposed to a randomly diluted CHIKV stock of SL11131 (left, test plate 1) or Ross (right, test plate 2) strain for 2 h in a 24-well plate and cultured in the presence of 1% methylcellulose and 2% FBS. Cells were fixed with formaldehyde and stained with crystal violet after three days. Images of the test plates were obtained using a flatbed scanner. (B) Plaques in test plates #1 (top) and #2 (bottom) were counted by plaQuest and manually by four analysts (#1–4). Linear regression analysis was performed using the plaque counts in each well obtained by plaQuest (Y-axes) and manual counts (X-axes). (C) Plaque counts obtained by plaQuest (blue squares) and average counts by four analysts (red circles, mean ± SD) are shown for individual wells. Written informed consent was obtained from four analysts who participated in the manual counting of test plates prior to the comparative test.
Fig. 3
Fig. 3
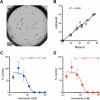
Evaluation of the CHIKV inhibitor by plaQuest. HeLa cells were infected with CHIKV SL11131 and cultured in the presence of a serial concentration of MPA (or 0.1% DMSO). Two days after the infection, culture supernatants were collected and subjected to a cytotoxic plaque assay using Vero cells. (A) Plaques were counted by an analyst (manual) and plaQuest, and the linear regression line is shown for the number of plaques in the same well. (B, C) Inhibition curves were generated by the four-parameter fitting method using the percentage reduction of plaques counted by plaQuest (B) and manually (C) from three independent infection experiments.
Fig. 4
Fig. 4
Application of plaQuest to the cytotoxic plaque assay of SARS-CoV-2. (A) Detection of plaques formed by SARS-CoV-2 using plaQuest. SARS-CoV-2 Wuhan/D614G was incubated with a serial dilution (10, 5, 2.5, 1.25, 0.625, 0.312, and 0.156 µg/ml) of a spike-neutralizing antibody or PBS. The virus/antibody mixture was then subjected to a cytotoxic plaque assay using Vero E6/TMPRSS2 cells. A representative well in which SARS-CoV-2 plaques were detected by plaQuest is shown. (B) Comparison of plaQuest and manual counts in the PRNT for SARS-CoV-2. Plaques obtained by PRNT from a 24-well plate were counted by an analyst (manual, X-axes) and by plaQuest (Y-axes). The linear regression line is shown for the plaque counts in the same well. (C, D) Neutralization curves. The curves were generated from the percentage of reduction in plaques obtained by plaQuest (C) and manual (D) counts from three independent titration experiments.
Fig. 5
Fig. 5
Application of plaQuest to the fluorescent plaque assay. Calu-3 cells were infected with SARS-CoV-2 Omicron BA.5 and treated with serial concentrations of ivermectin (or 0.1% DMSO). Two days after infection, the culture supernatants were subjected to the plaque assay using Vero E6/TMPRSS2 cells. Vero E6/TMPRSS2 cells were fixed and permeabilized, and virus-formed plaques were stained with anti-SARS-CoV-2 nucleocapsid primary antibody and Alexa Fluor 555-conjugated secondary antibody. A fluorescent plaque image was obtained using a Typhoon FLA 9000 scanner. (A) Detection of immunostained viral plaques by plaQuest. (B) The linear regression analysis. Immunostained plaques counted by an analyst (manual, X-axes) and by plaQuest (Y-axes) were compared. (C, D) Inhibition curves. The curves were generated by the percentage reduction of plaques counted by plaQuest (C) and manually (D) from three independent infection experiments.
Fig. 6
Fig. 6
Application of plaQuest to chromogenic plaque assay. One hundred PFU of DENV were incubated with serial dilutions (100, 50, 25, 12.5, 6.25, and 3.125 µg/ml) of an anti-flavivirus envelope antibody (4G2) or PBS and subjected to a chromogenic plaque assay using Vero cells. (A) A representative well in which DENV plaques were detected by plaQuest. (B) The linear regression analysis. Immunostained plaques counted by an analyst (manual, X-axes) and plaQuest (Y-axes) were compared. (C, D) Neutralization curves of 4G2. The curves were generated from the percentage of reduction in plaques obtained by plaQuest (C) and manual (D) counts from three independent titration experiments.

Similar articles

References

    1. Condit, R. C. Principles of virology. In Fields Virology, 5th edn (eds Knipe, D. M. & Howley, P. M.) Vol. I 25–57 (Lippincott Williams & Wilkins, 2007).
    1. Dulbecco, R. Production of plaques in monolayer tissue cultures by single particles of an animal virus. Proc. Natl. Acad. Sci. USA. 38, 747–752 (1952). - PMC - PubMed
    1. The Science of Virology. In Principles of Virology: Molecular Biology, Pathogenesis, and Control 29–31 (eds Flint, S. J., Enquist, L. W., Krug, R. M., Racaniello, V. R. & Skalka) (ASM, 2000).
    1. Weaver, S. C. & Lecuit, M. Chikungunya virus and the global spread of a mosquito-borne disease. N Engl. J. Med.372, 1231–1239 (2015). - PubMed
    1. Couderc, T. & Lecuit, M. Chikungunya virus pathogenesis: From bedside to bench. Antiviral Res.121, 120–131 (2015). - PubMed