

GeOKG: geometry-aware knowledge graph embedding for Gene Ontology and genes
- PMID: 40217132
- PMCID: PMC12036960
- DOI: 10.1093/bioinformatics/btaf160
GeOKG: geometry-aware knowledge graph embedding for Gene Ontology and genes
Abstract
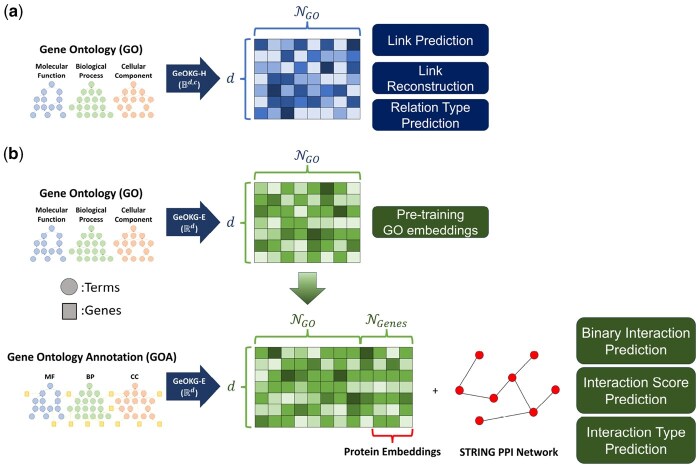
Motivation: Leveraging deep learning for the representation learning of Gene Ontology (GO) and Gene Ontology Annotation (GOA) holds significant promise for enhancing downstream biological tasks such as protein-protein interaction prediction. Prior approaches have predominantly used text- and graph-based methods, embedding GO and GOA in a single geometric space (e.g. Euclidean or hyperbolic). However, since the GO graph exhibits a complex and nonmonotonic hierarchy, single-space embeddings are insufficient to fully capture its structural nuances.
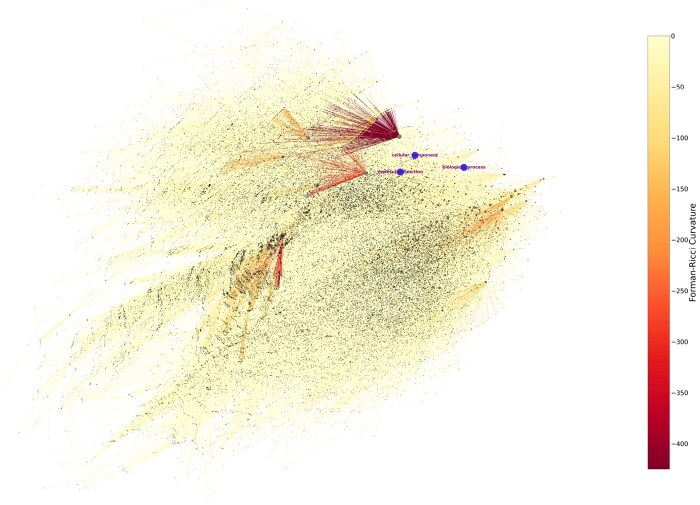
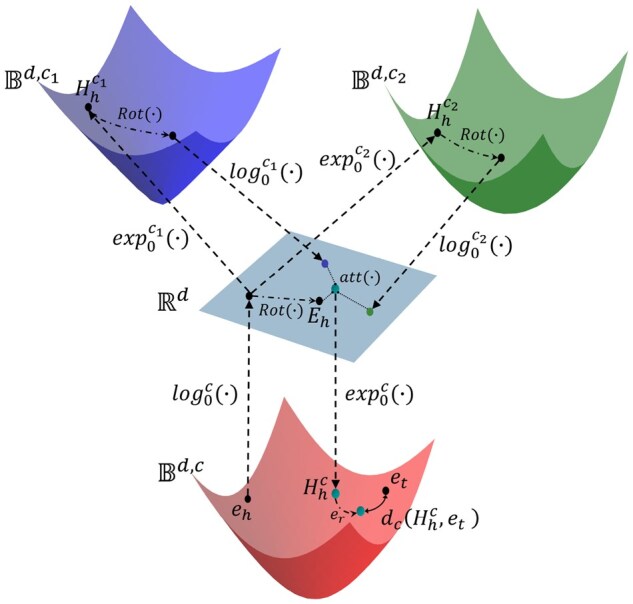
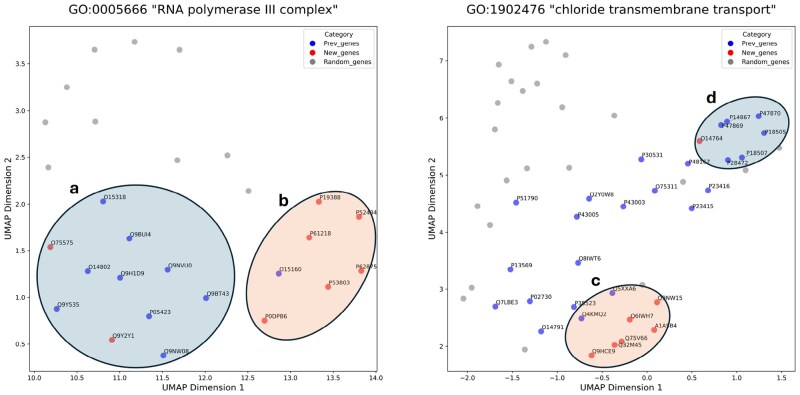
Results: In this study, we address this limitation by exploiting geometric interaction to better reflect the intricate hierarchical structure of GO. Our proposed method, Geometry-Aware Knowledge Graph Embeddings for GO and Genes (GeOKG), leverages interactions among various geometric representations during training, thereby modeling the complex hierarchy of GO more effectively. Experiments at the GO level demonstrate the benefits of incorporating these geometric interactions, while gene-level tests reveal that GeOKG outperforms existing methods in protein-protein interaction prediction. These findings highlight the potential of using geometric interaction for embedding heterogeneous biomedical networks.
Availability and implementation: https://github.com/ukjung21/GeOKG.
© The Author(s) 2025. Published by Oxford University Press.
Figures
Similar articles
-
HiG2Vec: hierarchical representations of Gene Ontology and genes in the Poincaré ball.Bioinformatics. 2021 Sep 29;37(18):2971-2980. doi: 10.1093/bioinformatics/btab193. Bioinformatics. 2021. PMID: 33760022 Free PMC article.
-
Graph embeddings on gene ontology annotations for protein-protein interaction prediction.BMC Bioinformatics. 2020 Dec 16;21(Suppl 16):560. doi: 10.1186/s12859-020-03816-8. BMC Bioinformatics. 2020. PMID: 33323115 Free PMC article.
-
Anc2vec: embedding gene ontology terms by preserving ancestors relationships.Brief Bioinform. 2022 Mar 10;23(2):bbac003. doi: 10.1093/bib/bbac003. Brief Bioinform. 2022. PMID: 35136916
-
An experimental analysis of graph representation learning for Gene Ontology based protein function prediction.PeerJ. 2024 Nov 14;12:e18509. doi: 10.7717/peerj.18509. eCollection 2024. PeerJ. 2024. PMID: 39553733 Free PMC article. Review.
-
Graph embedding and geometric deep learning relevance to network biology and structural chemistry.Front Artif Intell. 2023 Nov 16;6:1256352. doi: 10.3389/frai.2023.1256352. eCollection 2023. Front Artif Intell. 2023. PMID: 38035201 Free PMC article. Review.
References
-
- Balazevic I, Allen C, Hospedales T. Multi-relational poincaré graph embeddings. In: Proceedings of the 33rd International Conference on Neural Information Processing Systems, 2019, 4463–73.
-
- Bordes A, Usunier N, Garcia-Duran A et al. Translating embeddings for modeling multi-relational data. In: Proceedings of the 27th International Conference on Neural Information Processing Systems, 2013, 2787–95.
-
- Cao Z, Xu Q, Yang Z et al. Geometry interaction knowledge graph embeddings. AAAI 2022;36:5521–9.
MeSH terms
Grants and funding
LinkOut - more resources
Full Text Sources
