

Population genomics of sika deer reveals recent speciation and genetic selective signatures during evolution and domestication
- PMID: 40217144
- PMCID: PMC11987376
- DOI: 10.1186/s12864-025-11541-w
Population genomics of sika deer reveals recent speciation and genetic selective signatures during evolution and domestication
Abstract
Background: Population genomic analysis can reconstruct the phylogenetic relationship and demographic history, and identify genomic selective signatures of a species. To date, fundamental aspects of population genomic analyses, such as intraspecies taxonomy, evolutionary history, and adaptive evolution, of sika deer have not been systematically investigated. Furthermore, accumulating lines of evidences have illustrated that incorrect species delimitation will mislead conservation decisions, and even lead to irreversible mistakes in threatened species.
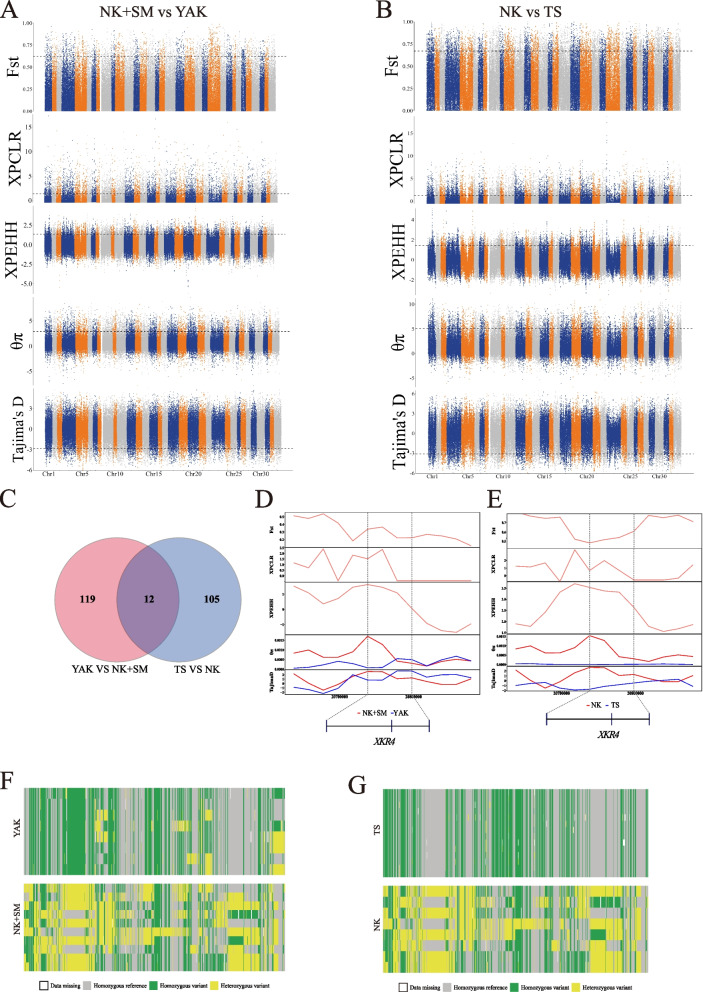
Results: In this study, we resequenced 81 wild and 71 domesticated sika deer representing 10 main geographic populations and two farms to clarify the species delimitation, demographic and divergence histories, and adaptive evolution of this species. First, our analyses of whole genomes, Y chromosomes and mitochondrial genomes revealed substantial genetic differentiation between the continental and Japanese lineages of sika deer, representing two phylogenetically distinct species. Second, sika deer in Japan were inferred to have experienced a "divergence-mixing-isolation" evolutionary scenario. Third, we identified four candidate genes (XKR4, NPAS3, CTNNA3, and CNTNAP5) possibly involved in body size regulation of sika deer by selective sweep analysis. Furthermore, we also detected two candidate genes (NRP2 and EDIL3) that may be associated with an important economic trait (antler weight) were under selection during the process of domestication.
Conclusion: Population genomic analyses revealed that the continental and Japanese lineages represent distinct phylogenetic species. Moreover, our results provide insights into the genetic selection signatures related to body size differences and a valuable genomic resource for future genetic studies and genomics-informed breeding of sika deer.
Keywords: Cervus nippon; Domestication; Genetic selective signature; Population genomics; Sika deer; Species delimitation.
© 2025. The Author(s).
Conflict of interest statement
Declarations. Ethics approval and consent to participate: Informed consent was obtained from all participating institutions and individual collaborators. Handling and sampling of the 152 sika deer were performed in accordance with the ARRIVE guidelines ( https://arriveguidelines.org ) and the guidelines for the care and use of experimental animals established by the Ministry of Agriculture and Rural Affairs of China, and all experiments were approved by the Institutional Animal Care and Use Committee of the Institute of Special Economic Animal and Plant Sciences, Chinese Academy of Agricultural Sciences (Approval No. ISAPSAEC-2014–016), Changchun, China. Consent for publication: Not applicable. Competing interests: The authors declare no competing interests.
Figures


Similar articles
-
Two genetically distinct lineages of the sika deer, Cervus nippon, in Japanese islands: comparison of mitochondrial D-loop region sequences.Mol Phylogenet Evol. 1999 Dec;13(3):511-9. doi: 10.1006/mpev.1999.0668. Mol Phylogenet Evol. 1999. PMID: 10620409
-
Phylogeography of sika deer (Cervus nippon) inferred from mitochondrial cytochrome-b gene and microsatellite DNA.Gene. 2021 Mar 10;772:145375. doi: 10.1016/j.gene.2020.145375. Epub 2020 Dec 23. Gene. 2021. PMID: 33359125
-
A consensus genome of sika deer (Cervus nippon) and transcriptome analysis provided novel insights on the regulation mechanism of transcript factor in antler development.BMC Genomics. 2024 Jun 19;25(1):617. doi: 10.1186/s12864-024-10522-9. BMC Genomics. 2024. PMID: 38890595 Free PMC article.
-
Domestication genomics: evidence from animals.Annu Rev Anim Biosci. 2014 Feb;2:65-84. doi: 10.1146/annurev-animal-022513-114129. Epub 2013 Nov 20. Annu Rev Anim Biosci. 2014. PMID: 25384135 Review.
-
Population genomics and the bacterial species concept.Methods Mol Biol. 2009;532:367-77. doi: 10.1007/978-1-60327-853-9_21. Methods Mol Biol. 2009. PMID: 19271196 Free PMC article. Review.
References
-
- Harris RB. 2015. Cervus nippon. The IUCN Red List of Threatened Species 2015:e.T41788A22155877. 10.2305/IUCN.UK.2015-2.RLTS.T41788A22155877.en
-
- Nagata J, Masuda R, Kaji K, Kaneko M, Yoshida MC. Genetic variation and population structure of the Japanese sika deer (Cervus nippon) in Hokkaido Island, based on mitochondrial D-loop sequences. Mol Ecol. 1998;7(7):871–7. - PubMed
MeSH terms
Grants and funding
LinkOut - more resources
Full Text Sources
Miscellaneous
