

Genome-wide identification and gene expression pattern analysis of the carotenoid cleavage oxygenase gene family in Fagopyrum tataricum
- PMID: 40217154
- PMCID: PMC11992870
- DOI: 10.1186/s12870-025-06503-z
Genome-wide identification and gene expression pattern analysis of the carotenoid cleavage oxygenase gene family in Fagopyrum tataricum
Abstract
Background: Carotenoid cleavage oxygenases (CCOs) convert carotenoids into volatile aromatic compounds implicated in plant growth and development. They affect the synthesis of hormones, including abscisic acid (ABA) and strigolactone (SL). However, the CCO family in Tartary buckwheat remains unelucidated.
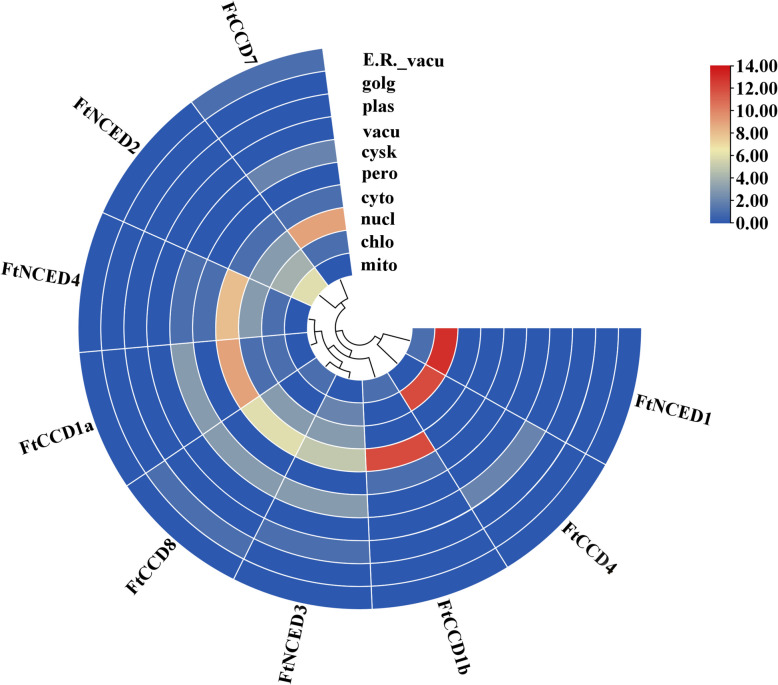
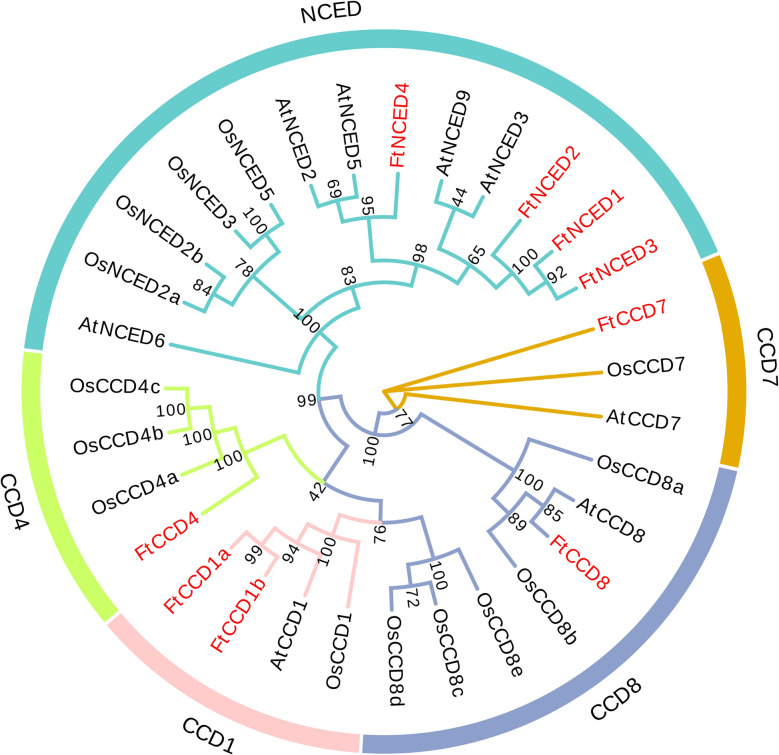
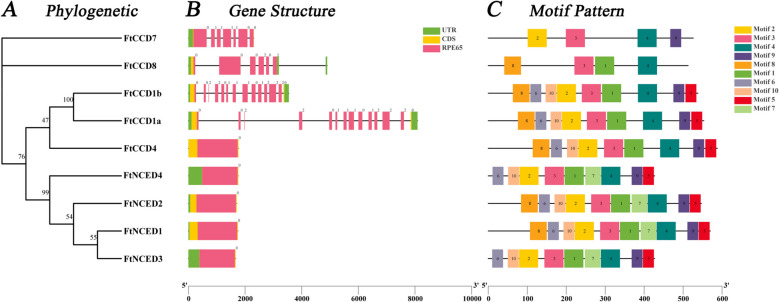
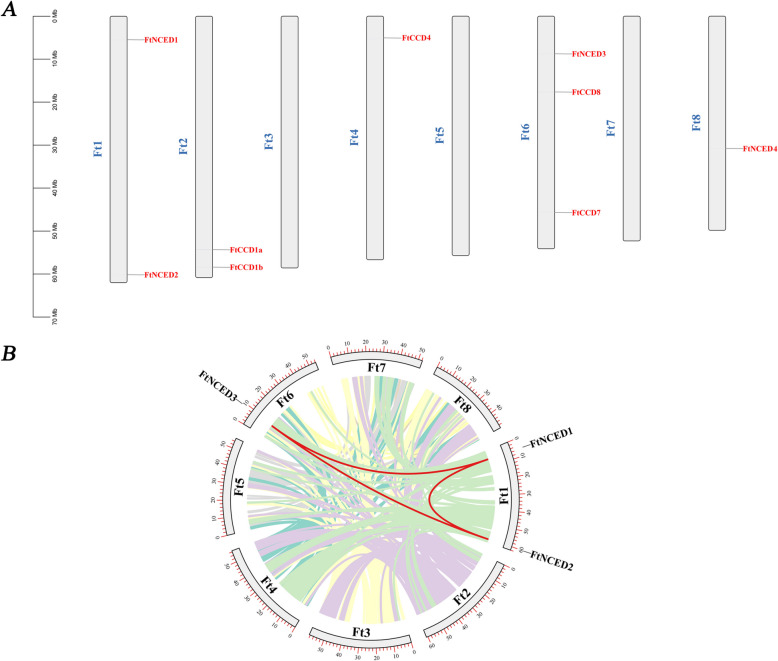
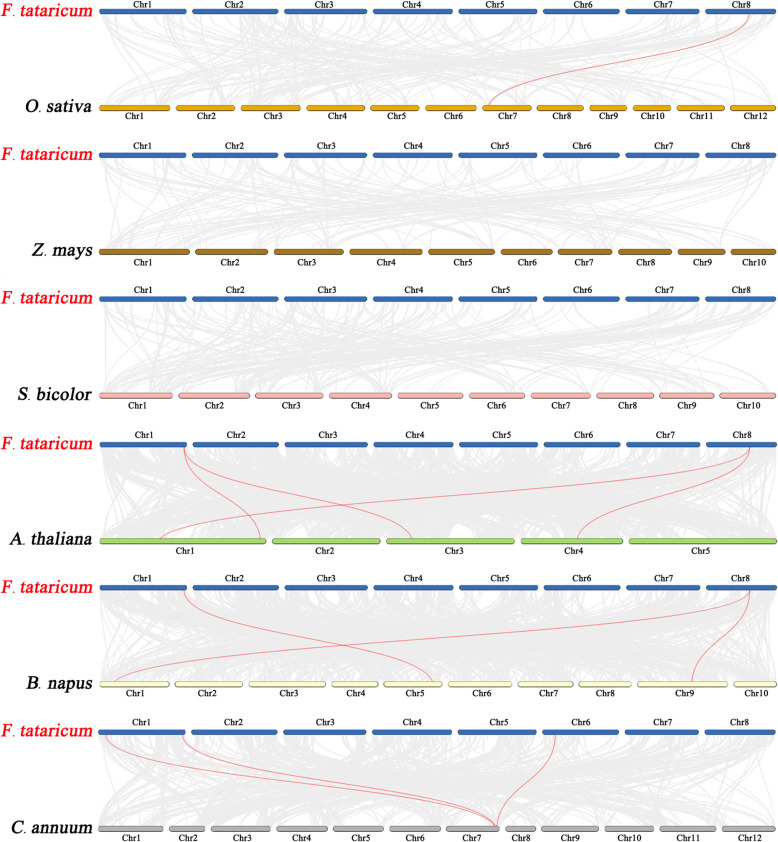
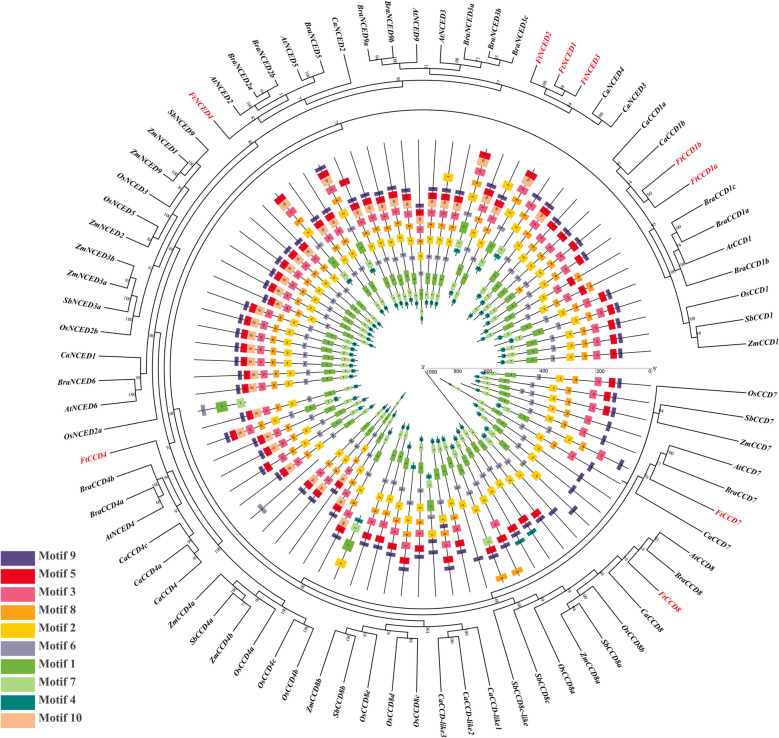
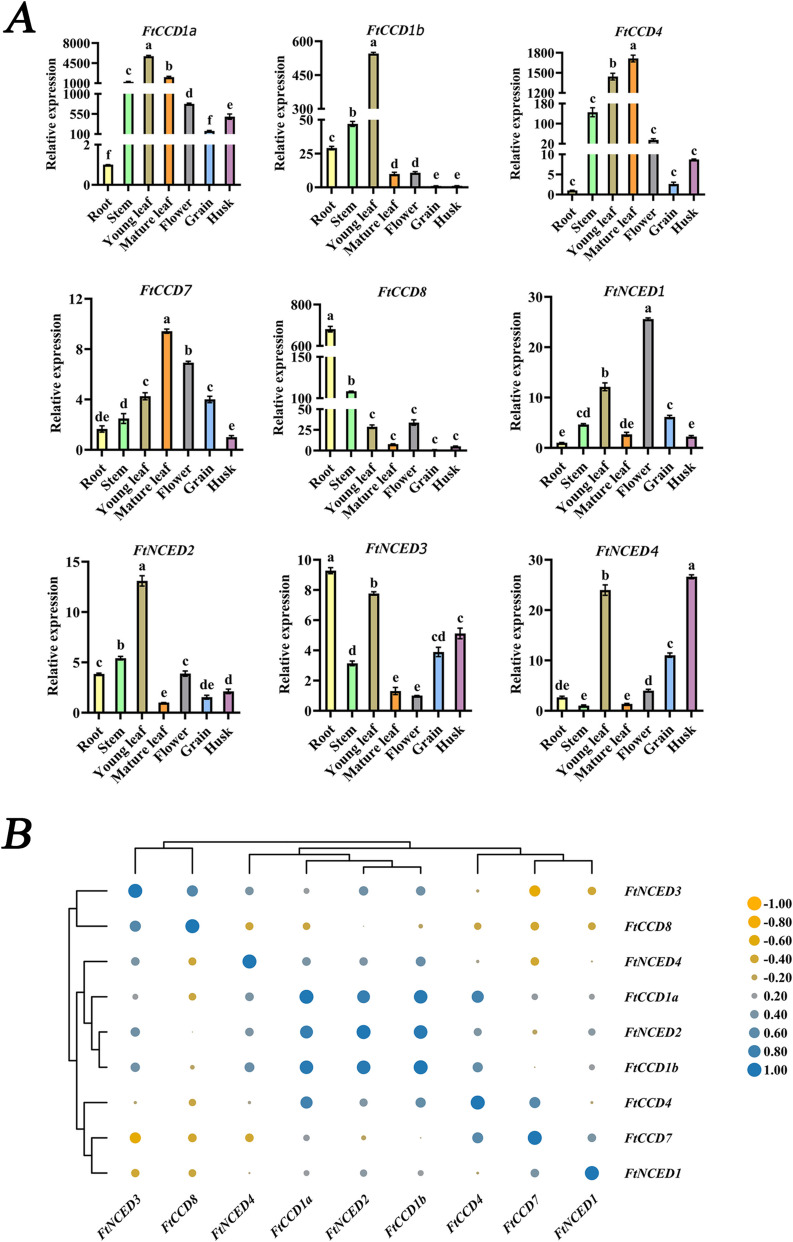
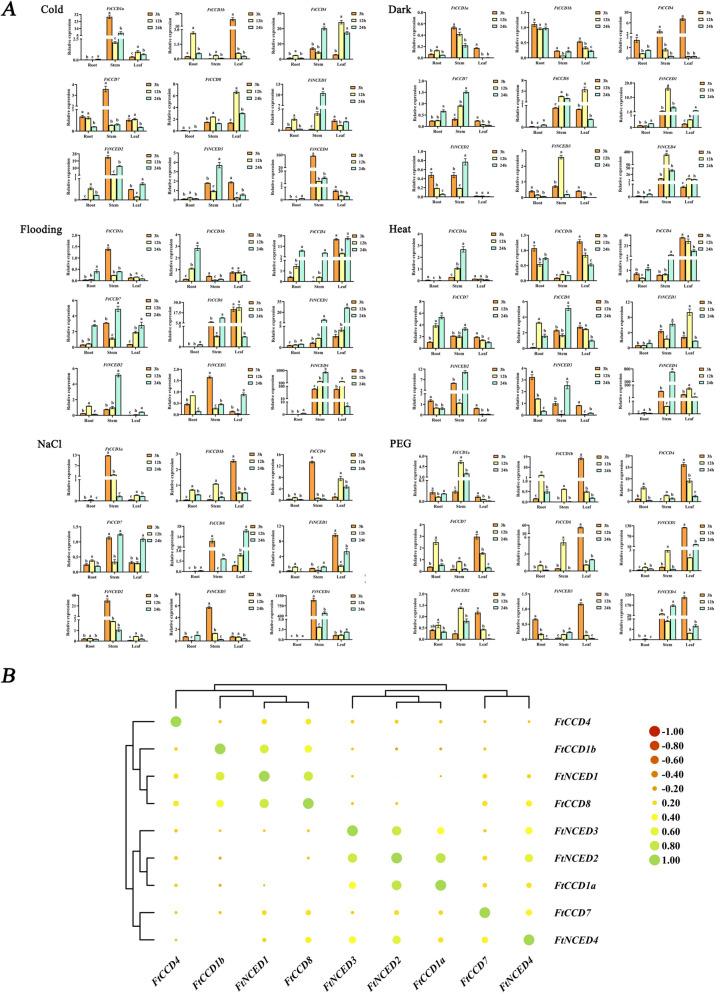
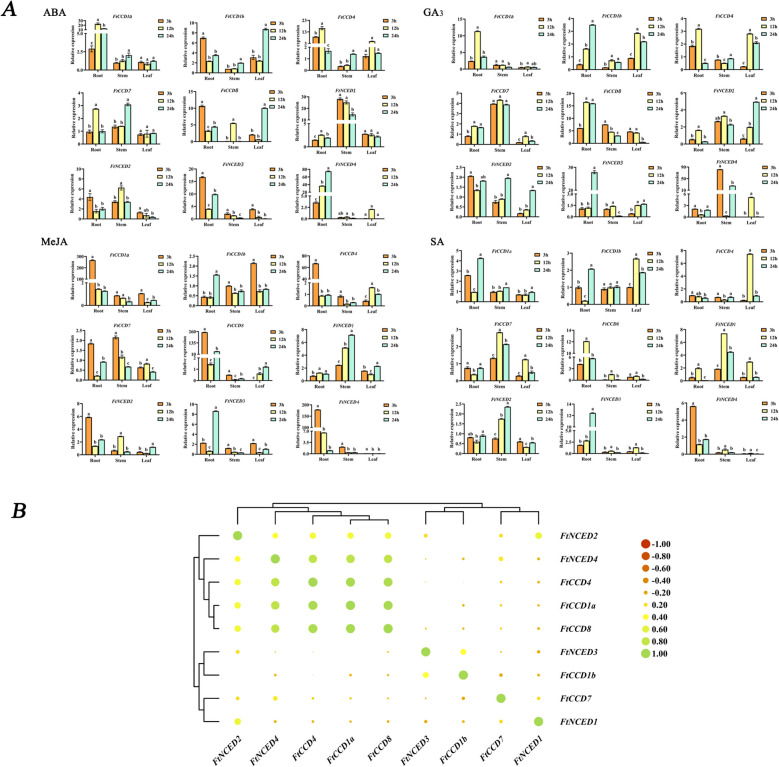
Results: We identified the FtCCO gene family based on Tartary buckwheat genomic data and analyzed the biological function of the FtCCO genes using bioinformatics methods and the expression pattern of the gene using fluorescence quantitative PCR. Three pairs of fragment duplication genes were found in FtCCOs, and the motifs were highly conserved within the same subfamily. FtCCO genes are closely related to the dicotyledonous Arabidopsis thaliana, which has the highest number of co-linear genes. The qRT-PCR showed that among the tissue-specific expression patterns of Tartary buckwheat CCO genes, the expression of the FtCCOs was higher in the leaves. In Tartary buckwheat grain development, the relative expression of most FtCCOs was higher at the later stage. The relative expression of many genes was higher in the stems under cold, dark, NaCl, and abiotic stress conditions. However, under the hormone and plant growth regulator treatments, the expression of the nine FtCCOs was relatively low in the stems. Notably, the relative expression of FtNCED4 was extremely high under abiotic stress and hormone induction, indicating that FtNCED4 may be involved in the growth and development of Tartary buckwheat. In this study, the FtCCO family genes of Tartary buckwheat were identified at the genome-wide level, and the gene expression pattern of the FtCCO gene family in different tissues or treatments was determined. This study provides a theoretical basis for further analysis of the functions of theFtCCO family, which is of great significance for the mining of resistance genes and trait improvement.
Keywords: CCO gene family; Fagopyrum tataricum; Evolution analysis; Expression patterns; Genome-wide analysis.
© 2025. The Author(s).
Conflict of interest statement
Declarations. Ethics approval and consent to participate: Plant materials, and collection do not necessitate licensing. The plant materials were maintained in accordance with the institutional guidelines established by the College of Agriculture at Guizhou University. The methodologies employed adhered to the pertinent guidelines and regulations. It should be noted that this study did not involve any human participants or animal experimentation carried out by the authors. Consent for publication: Not applicable. Competing interests: H. L., A. H., X. Y., S. Y., and J. R. conceived and designed the study. H. L., X. Y., H. Y., G. X., and Y. F. performed the experiments. H. L. and A. H. analyzed the data and wrote the manuscript, while S. Y., and J. R. supervised the research and revised the manuscript. All authors reviewed the manuscript.
Figures

Similar articles
-
Genome-wide identification, abiotic stress, and expression analysis of PYL family in Tartary buckwheat (Fagopyrum tataricum (L.) Gaertn.) during grain development.BMC Plant Biol. 2024 Jul 30;24(1):725. doi: 10.1186/s12870-024-05447-0. BMC Plant Biol. 2024. PMID: 39080537 Free PMC article.
-
Genome-wide identification and gene expression pattern analysis of the glycoside hydrolase family 1 in Fagopyrum tataricum.BMC Plant Biol. 2024 Dec 18;24(1):1183. doi: 10.1186/s12870-024-05919-3. BMC Plant Biol. 2024. PMID: 39695944 Free PMC article.
-
Genome-wide identification and expression analysis of the trihelix transcription factor family in tartary buckwheat (Fagopyrum tataricum).BMC Plant Biol. 2019 Aug 7;19(1):344. doi: 10.1186/s12870-019-1957-x. BMC Plant Biol. 2019. PMID: 31390980 Free PMC article.
-
Genome-wide investigation of the ZF-HD gene family in Tartary buckwheat (Fagopyrum tataricum).BMC Plant Biol. 2019 Jun 11;19(1):248. doi: 10.1186/s12870-019-1834-7. BMC Plant Biol. 2019. PMID: 31185913 Free PMC article.
-
Deep sequencing of the transcriptome reveals distinct flavonoid metabolism features of black tartary buckwheat (Fagopyrum tataricum Garetn.).Prog Biophys Mol Biol. 2017 Mar;124:49-60. doi: 10.1016/j.pbiomolbio.2016.11.003. Epub 2016 Nov 9. Prog Biophys Mol Biol. 2017. PMID: 27836511 Review.
Cited by
-
Genome-wide identification of CCD gene family in Peach (Prunus persica L. Batsch) and expression analysis with aroma norisoprenoids.BMC Plant Biol. 2025 Jul 24;25(1):954. doi: 10.1186/s12870-025-06991-z. BMC Plant Biol. 2025. PMID: 40702414 Free PMC article.
References
-
- Chen H, Zuo X, Shao H, Fan S, Ma J, Zhang D, Zhao C, Yan X, Liu X, Han M. Genome-wide analysis of carotenoid cleavage oxygenase genes and their responses to various phytohormones and abiotic stresses in apple (Malus domestica). Plant Physiol Biochem. 2018;123:81–93. 10.1016/j.plaphy.2017.12.001. - PubMed
MeSH terms
Substances
Grants and funding
- Guida Lingjun Hezi (2023) 07/Research and Integrated Application of Key Technologies for Green and High Yield in Mountainous Characteristic Agriculture
- Qiankehe Platform Talent-BQW (2024) 009/Construction of Scientific and Technological Innovation Talent Team for High-Quality and High-Efficiency Mechanization of Speciality Mixed Grains in Guizhou Province
- 32372051, 32160669, 32161143005/the Natural Science Foundation of China
LinkOut - more resources
Full Text Sources
