

Chemical, optical, and morphological properties of TPU and PET-G samples after aging in artificial saliva: an in vitro study
- PMID: 40217188
- PMCID: PMC11987292
- DOI: 10.1186/s12903-025-05863-0
Chemical, optical, and morphological properties of TPU and PET-G samples after aging in artificial saliva: an in vitro study
Abstract
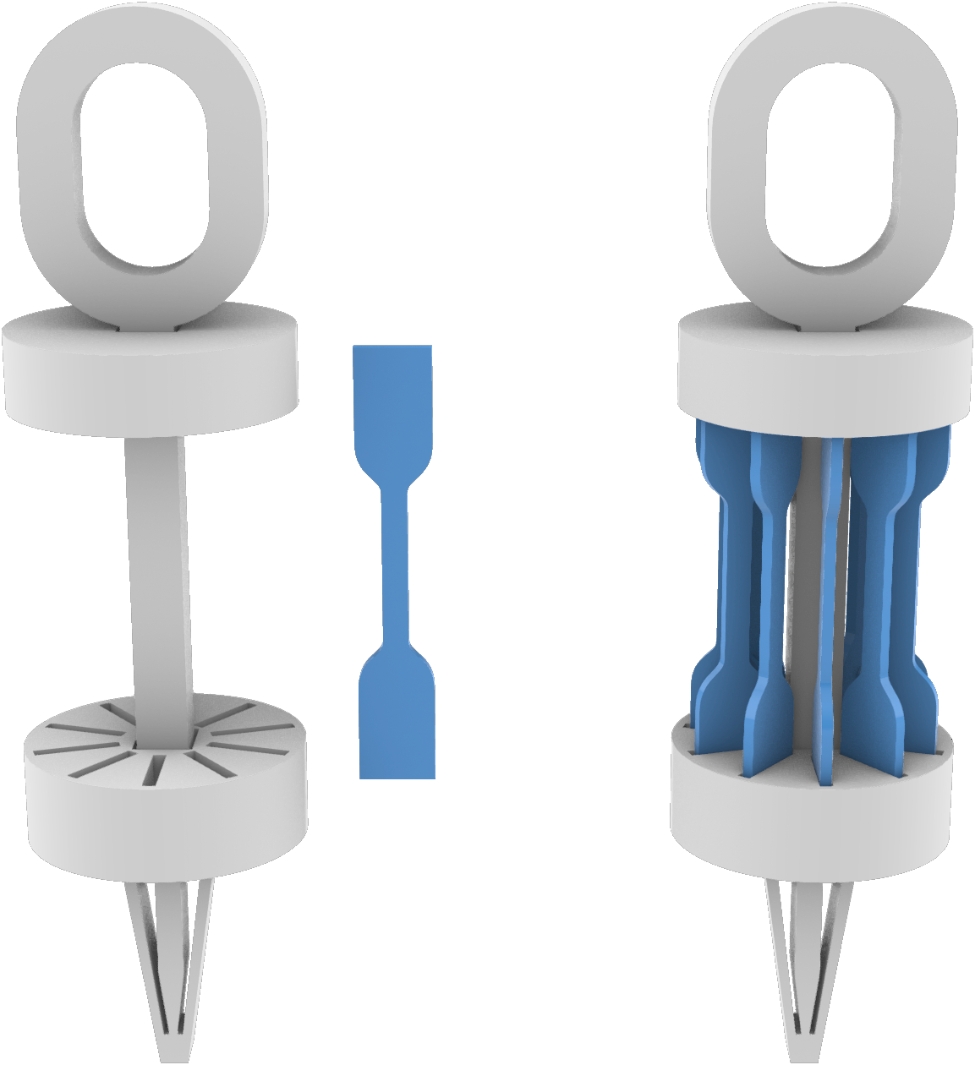
Background: Thermoplastic materials, such as glycol-modified polyethylene terephthalate (PET-G) and thermoplastic polyurethane (TPU), undergo alterations due to environmental factors in the oral cavity, which can affect their composition and surface properties over time. While previous studies have explored these changes, a comprehensive characterization of TPU and PET-G properties, particularly after immersion in artificial saliva, remains limited. This study aimed to evaluate the aging process of 24 TPU and 24 PET-G dumbbell-shaped specimens before and after exposure to artificial saliva. The analysis focused on the morphological, chemical, and optical properties of the samples, including thickness, weight, and surface roughness.
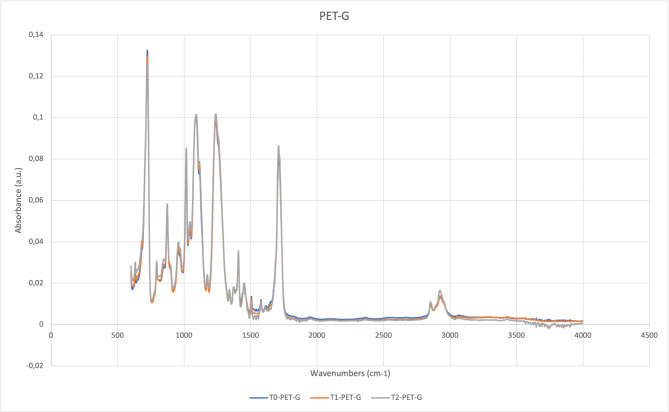
Methods: The study examined 48 thermoplastic samples, equally divided between PET-G and TPU. The samples were thermoformed into standardized shapes and analyzed at three time points: after thermoforming (T0), after 7 days (T1), and after 14 days (T2) of immersion in artificial saliva at 37 °C. Measurements included weight, thickness, surface roughness, absorbance, and Fourier transform infrared spectroscopy (FTIR). Data were analyzed using one-way ANOVA to identify significant changes over time, with a significance level of p < 0.01.
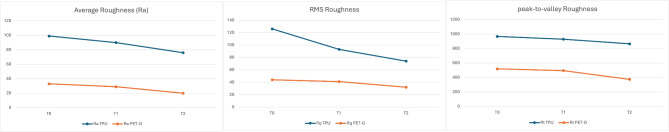
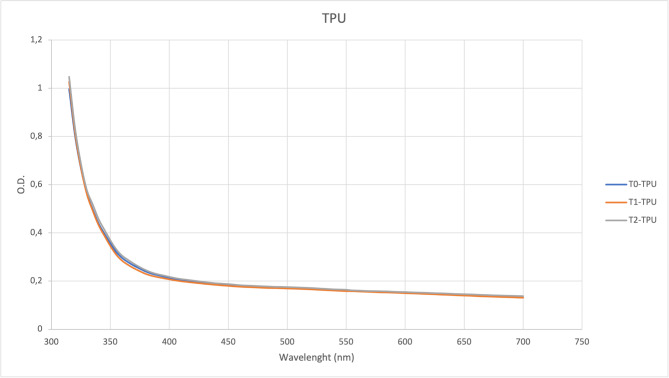
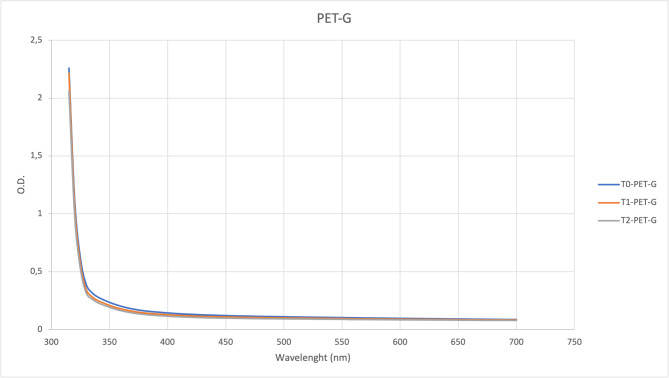
Results: Both materials exhibited significant reductions in surface roughness, with TPU showing a decrease in average roughness (Ra) from 99.43 nm at T0 to 76.53 nm at T2 (-23.02%) and PET-G decreasing from 33.25 nm to 20.19 nm (-39.27%). The root mean square roughness (Rq) in TPU declined by 41.67% (from 126.91 nm to 74.02 nm), while PET-G showed a reduction of 28.06% (from 44.98 nm to 32.35 nm). Peak-to-valley roughness (Rt) also decreased by 10.5% in TPU and 27.96% in PET-G. No statistically significant changes were observed in thickness, weight, optical density, or chemical composition (p > 0.01). The roughness disparity between TPU and PET-G persisted even after immersion in saliva.
Conclusions: Following the simulated intraoral aging process, significant changes in surface roughness were observed in TPU and PET-G specimens. The reduction in roughness, particularly a 39.27% decline in PET-G and 23.02% in TPU, has been clinically associated with decreased plaque accumulation and reduced friction between the aligner and the teeth.
Keywords: Artificial saliva aging; Clear aligners; Morphological properties; Surface roughness; Thermoplastic materials.
© 2025. The Author(s).
Conflict of interest statement
Declarations. Ethics approval and consent to participate: Not applicable. Consent for publication: Not applicable. Competing interests: The authors declare no competing interests.
Figures


Similar articles
-
Effects of Thermoforming on the Mechanical, Optical, Chemical, and Morphological Properties of PET-G: In Vitro Study.Polymers (Basel). 2024 Jan 10;16(2):203. doi: 10.3390/polym16020203. Polymers (Basel). 2024. PMID: 38257002 Free PMC article.
-
Time-dependent microbiome dynamics in orthodontic thermoplastic materials: comparing PETG and TPU.Clin Oral Investig. 2025 Jul 8;29(8):374. doi: 10.1007/s00784-025-06441-y. Clin Oral Investig. 2025. PMID: 40624404 Free PMC article.
-
Surface alterations and compound release from aligner attachments in vitro.Eur J Orthod. 2024 Aug 1;46(4):cjae026. doi: 10.1093/ejo/cjae026. Eur J Orthod. 2024. PMID: 38884540 Free PMC article.
-
Assessment of the Effect of Thermoforming Process and Simulated Aging on the Mechanical Properties of Clear Aligner Material.Cureus. 2024 Jul 19;16(7):e64933. doi: 10.7759/cureus.64933. eCollection 2024 Jul. Cureus. 2024. PMID: 39156374 Free PMC article.
-
Influence of thermal cycles and disinfection on the roughness, microhardness and color of PETG/TPU and PMMA.Polim Med. 2023 Jan-Jun;53(1):19-24. doi: 10.17219/pim/159350. Polim Med. 2023. PMID: 36929643
References
-
- Walton DK, Fields HW, Johnston WM, Rosenstiel SF, Firestone AR, Christensen JC. Orthodontic appliance preferences of children and adolescents. Am J Orthod Dentofac Orthop. 2010;138(6):698.e1-698.e12. - PubMed
-
- Shi C, Feng Y, Hsiao YC, Smith J, Jin C, Farella M, et al. Clear aligners brands and marketing claims: an overview of available information on the web. Australasian Orthodontic J. 2022;38(2):252–62.
-
- Zhang N, Bai Y, Ding X, Zhang Y. Preparation and characterization of thermoplastic materials for invisible orthodontics. Dent Mater J. 2011;30(6):954–9. - PubMed
-
- Ihssen BA, Willmann JH, Nimer A, Drescher D. Effect of in vitro aging by water immersion and thermocycling on the mechanical properties of PETG aligner material. J Orofac Orthop. 2019;80(6):292–303. - PubMed
MeSH terms
Substances
LinkOut - more resources
Full Text Sources
