

Prediction of radiosensitivity in non-small cell lung cancer based on computed tomography and tumor genomics: a multiple real world cohort study
- PMID: 40217247
- PMCID: PMC11992886
- DOI: 10.1186/s12931-025-03202-z
Prediction of radiosensitivity in non-small cell lung cancer based on computed tomography and tumor genomics: a multiple real world cohort study
Abstract
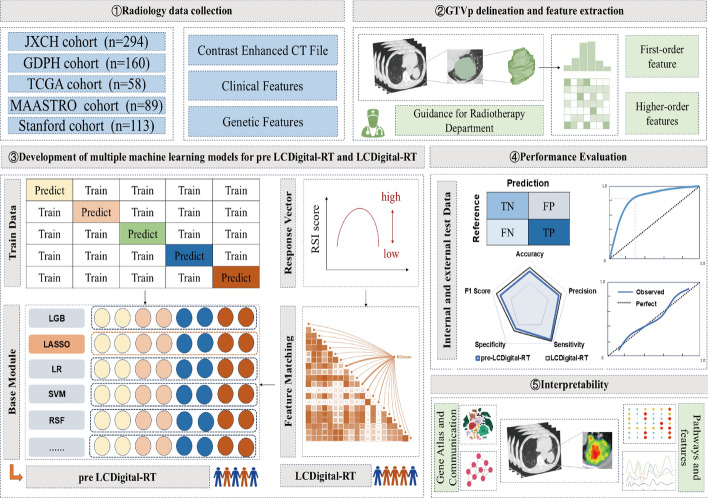
Background: The varying degrees of radiotherapy sensitivity of tumors limit the efficacy of tumor radiotherapy. In this research, based on single cell sequence data we used radiomics to help identify and screen feature signatures to distinguish varying radiosensitivity in different regions of the target area of non-small cell lung cancer can provide a new pattern to assess sensitivity of radiotherapy and assist in clinical decision-making.
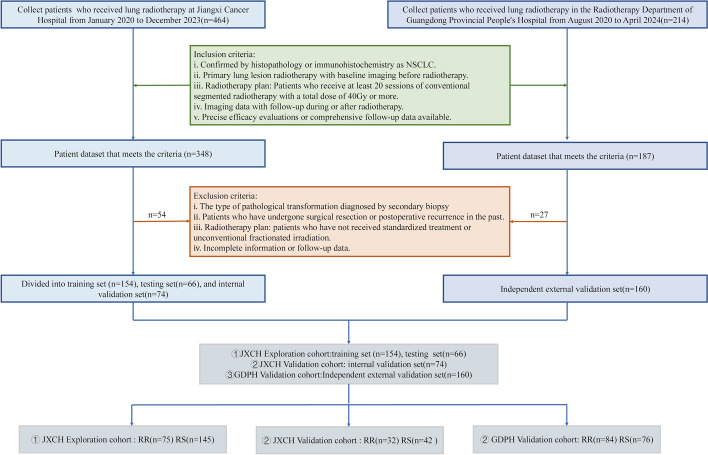
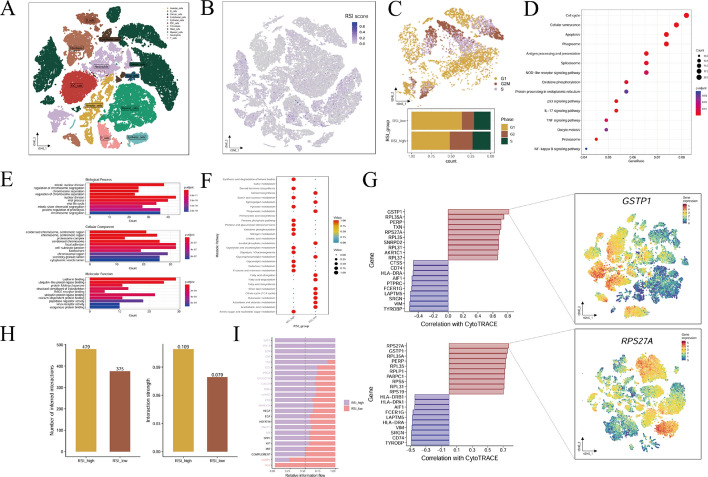
Methods: This retrospective study included CT radiology data from 454 patients diagnosed with non-small cell lung cancer in multiple real-world cohorts prior to radiotherapy. The tumor primary target area was delineated on a training set (n = 154) and segmented to obtain a radiogenomic single signature. The radiogenomic signature LCDigital-RT, which can predict radiosensitivity, was developed by combining transcriptome sequencing signature radiosensitivity index and validated on two independent external validation sets (n = 74) and (n = 160). Besides, we also described the single-cell landscape of non-small cell lung cancer with different radiosensitivity, attempting to explain the potential biological mechanism at the single-cell level.
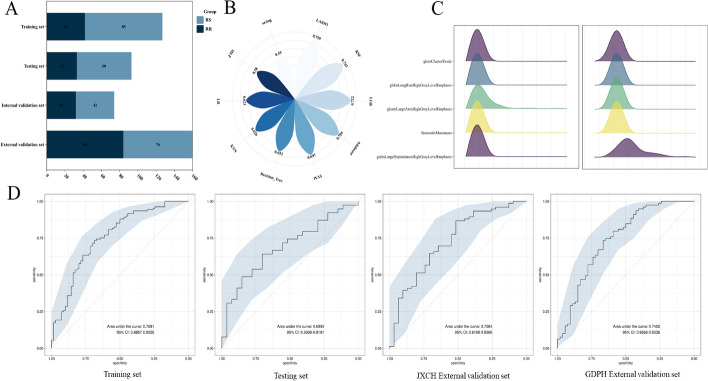
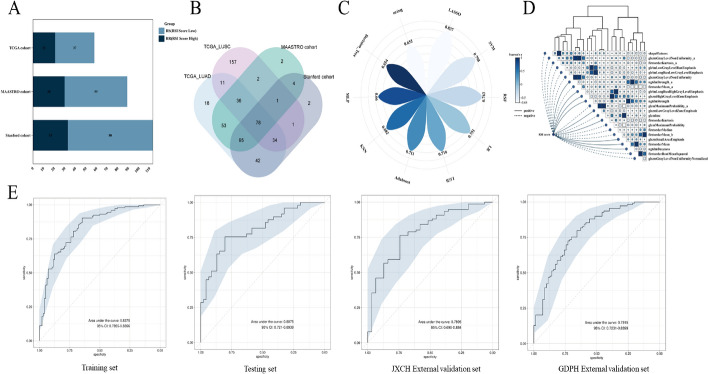
Results: By constructing solely from the single radiomics feature signature, pre LCDigital-RT can effectively identify populations with differences in radiation sensitivity in non-small cell lung cancer, with AUCs of 0.759, 0.728 and 0.745 for the training and two external validation sets, respectively. However, LCDigital-RT has a greater advantage, with a training set AUC of 0.837, which has been well validated in the JXCH cohort (AUC = 0.789) and GDPH cohort (AUC = 0.791). With the help of LCDigital-RT, patients can be divided into radiation sensitive and radiation resistant groups, and there is a significant difference in the characteristics of primary tumor lesions between the two groups. We have also enriched the interpretability of our radiogenomic features in biology at the single-cell level, demonstrating their enormous value in clinical translational research.
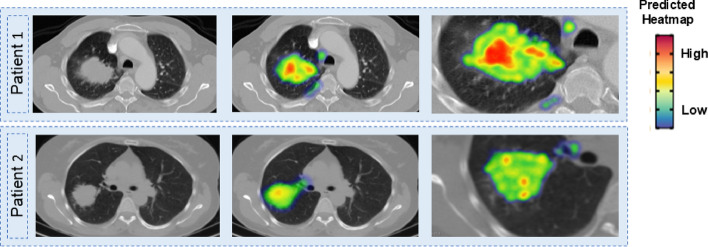
Conclusions: We have developed an LCDigital RT prediction tool that will help predict populations at risk of radiation sensitivity differences. By visualizing the thermal map of the primary tumor area, we can assist in the development of radiotherapy plans, reduce the occurrence of radiation toxicity events, and improve radiotherapy efficacy. At the same time, it provides a reference basis for evaluating radiation sensitivity from imaging, genetics, and other aspects.
Keywords: Non-small cell lung cancer; Radiogenomics; Radiosensitivity; Radiotherapy target area; Single cell sequencing technology.
© 2025. The Author(s).
Conflict of interest statement
Declarations. Ethics approval and consent to participate: This study is a multicenter retrospective study that meets the requirements of medical ethics design and is conducted in accordance with the 1964 Helsinki Declaration and its amendments or similar ethical standards. Permission to conduct the study was obtained from the Ethics Committee of Jiangxi Cancer Hospital and Guangdong People’s Hospital (2023ky232 and KY2024 - 576–01), informed consent was waived and data were anonymously collected. Consent for publication: Not applicable. Competing interests: The authors declare no competing interests.
Figures
Similar articles
-
Draw on advantages and avoid disadvantages: CT-derived individualized radiomic signature for predicting chemo-radiotherapy sensitivity in unresectable advanced non-small cell lung cancer.J Cancer Res Clin Oncol. 2024 Oct 10;150(10):453. doi: 10.1007/s00432-024-05971-4. J Cancer Res Clin Oncol. 2024. PMID: 39387925 Free PMC article.
-
Dosiomics and radiomics improve the prediction of post-radiotherapy neutrophil-lymphocyte ratio in locally advanced non-small cell lung cancer.Med Phys. 2024 Jan;51(1):650-661. doi: 10.1002/mp.16829. Epub 2023 Nov 14. Med Phys. 2024. PMID: 37963229
-
Enhancing the prediction of symptomatic radiation pneumonitis for locally advanced non-small-cell lung cancer by combining 3D deep learning-derived imaging features with dose-volume metrics: a two-center study.Strahlenther Onkol. 2025 Mar;201(3):274-282. doi: 10.1007/s00066-024-02221-x. Epub 2024 Mar 18. Strahlenther Onkol. 2025. PMID: 38498173
-
Primary tumor standardized uptake value measured on F18-Fluorodeoxyglucose positron emission tomography is of prediction value for survival and local control in non-small-cell lung cancer receiving radiotherapy: meta-analysis.J Thorac Oncol. 2014 Jun;9(6):834-42. doi: 10.1097/JTO.0000000000000185. J Thorac Oncol. 2014. PMID: 24787963 Free PMC article. Review.
-
Radiogenomics predicting tumor responses to radiotherapy in lung cancer.Semin Radiat Oncol. 2010 Jul;20(3):149-55. doi: 10.1016/j.semradonc.2010.01.002. Semin Radiat Oncol. 2010. PMID: 20685577 Free PMC article. Review.
References
MeSH terms
Grants and funding
LinkOut - more resources
Full Text Sources
Medical
