. 2025 Apr 11;23(1):434.
doi: 10.1186/s12967-025-06441-2.

Targeting PRDX2 to inhibit tumor growth and metastasis in triple-negative breast cancer: the role of FN1 and the PI3K/AKT/SP1 pathway

Affiliations

Targeting PRDX2 to inhibit tumor growth and metastasis in triple-negative breast cancer: the role of FN1 and the PI3K/AKT/SP1 pathway

Jiawei Zhou et al. J Transl Med. .

Abstract

Background: Triple-negative breast cancer (TNBC) is characterized by high invasiveness, high potential for metastasis, easy recurrence, and poor prognosis. There is an urgent need to develop new clinical treatments.

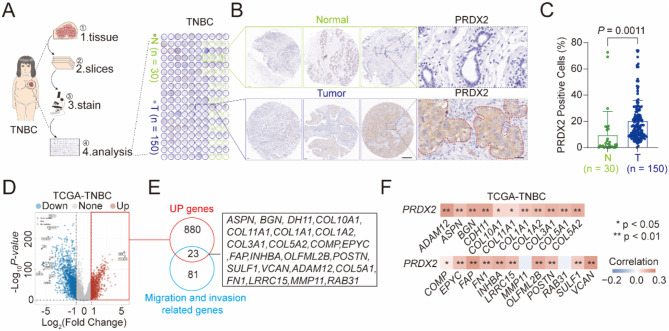
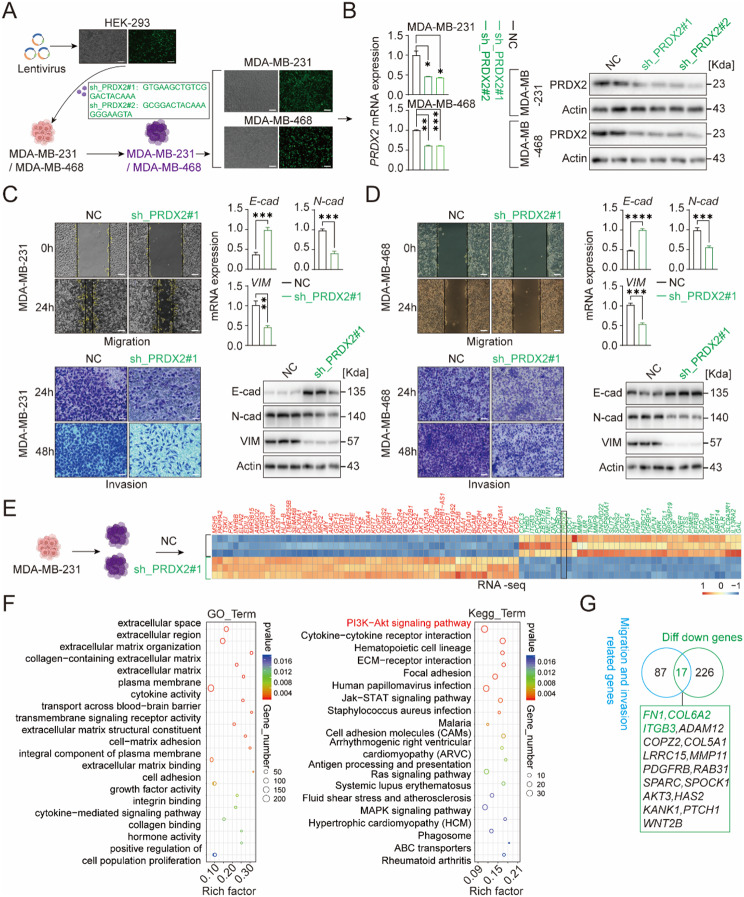
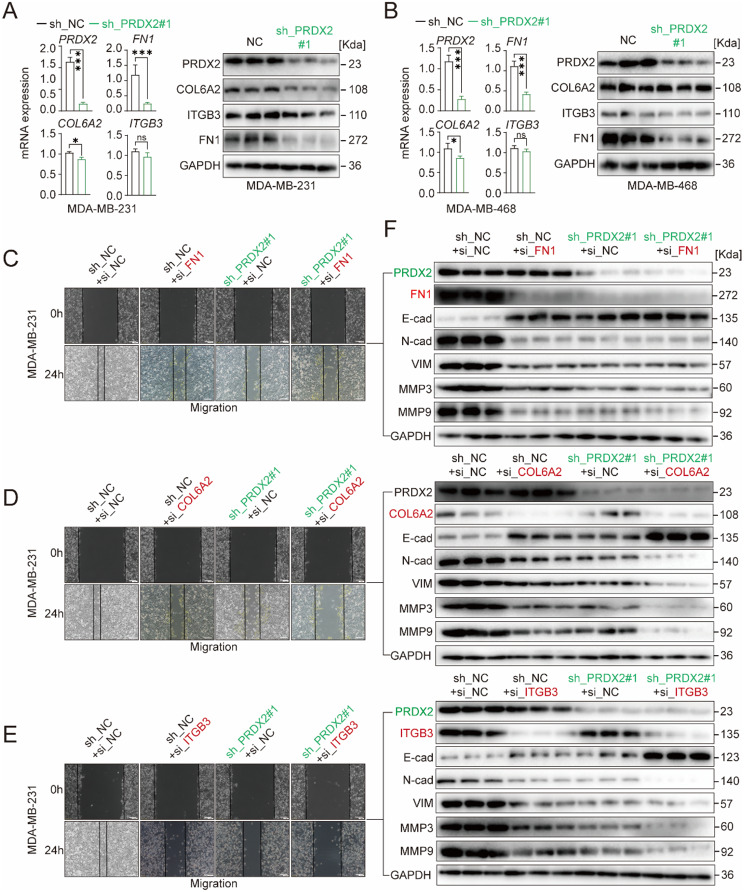
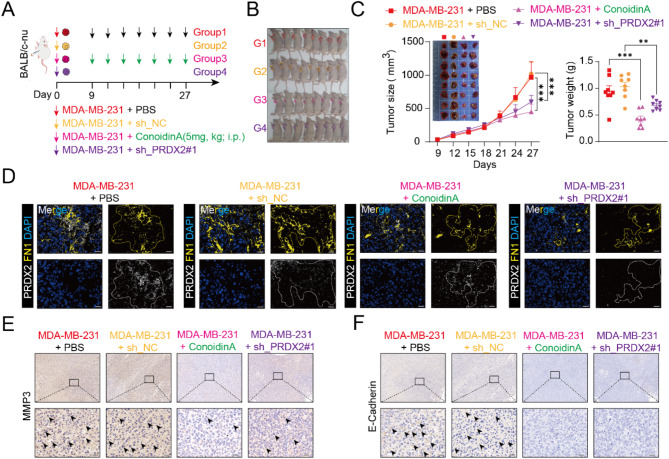
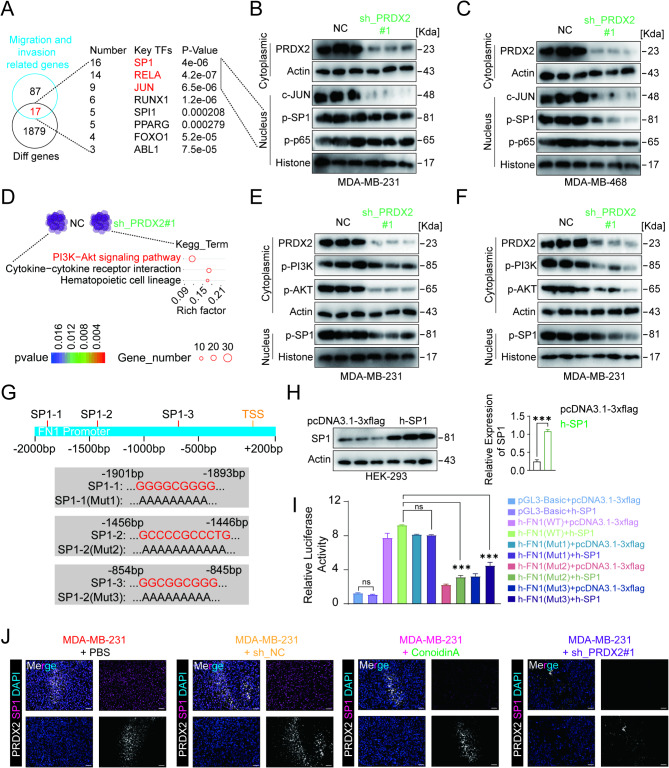
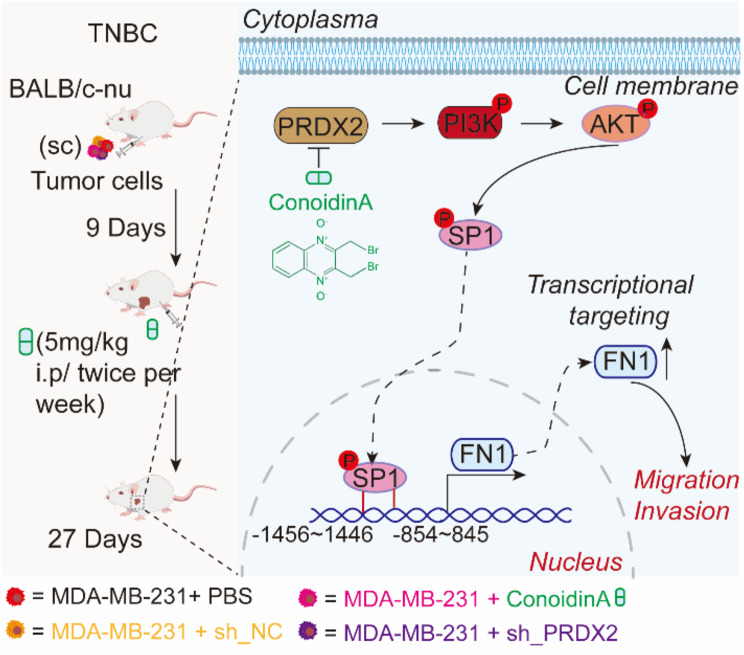
Methods: This study utilized TNBC tissue microarrays to detect Peroxiredoxin 2 (PRDX2) expression levels and analyzed the correlation between PRDX2 and tumor invasion as well as invasion-related gene expression through the TCGA database. A stable PRDX2-knockdown triple-negative breast cancer cell line was established using lentiviral technology. The effects of PRDX2 on triple-negative breast cancer cell migration, invasion, and epithelial-mesenchymal transition (EMT) were investigated via wound healing assays, Transwell assays, qPCR, and Western blotting. RNA sequencing (RNA-seq), Western blotting, and dual luciferase reporter assays were performed to confirm that PRDX2 regulates FN1 expression through SP1. Furthermore, subcutaneous tumor xenograft models in nude mice were constructed to assess the effects of PRDX2 knockdown and the PRDX2 inhibitor Conoidin A on tumor growth in vivo.

Results: Tissue microarray detection and correlative analysis revealed that PRDX2 is significantly upregulated in triple-negative breast cancer (TNBC) tumor tissues and positively correlated with genes associated with cell migration and invasion. Functional experiments demonstrated that in vitro knockdown of PRDX2 suppresses migration, invasion, and epithelial-mesenchymal transition (EMT) in TNBC cells. Furthermore, in vivo knockdown of PRDX2 or treatment with the PRDX2 inhibitor Conoidin A effectively reduced tumor burden. Mechanistic investigations utilizing RNA sequencing (RNA-seq) identified FN1 as a critical gene promoting TNBC cell migration and invasion. PRDX2 facilitates TNBC progression by activating the PI3K/AKT signaling pathway, which enhances SP1 binding to the FN1 gene promoter. This regulatory cascade ultimately drives tumor advancement in TNBC.

Conclusions: This study elucidates the role of the PRDX2/SP1/FN1 axis in TNBC migration and invasion, and highlights PRDX2 as a promising therapeutic target for triple-negative breast cancer.

Keywords: Cell migration and invasion; PI3K/AKT; PRDX2; SP1; TNBC.


Conflict of interest statement

Declarations. Ethics approval and consent to participate: The ethics involving human tissues (tissue microarrays of triple-negative breast cancer (TNBC) patients) were approved by the Ethics Committee of Shanghai New Tide Biotechnology Co., Ltd. (approval No. SHYJS-CP-2210008). The ethics involving animals was approved by the medical ethics committee of Anhui University of Science and Technology (approval NO. HX-002). Consent for publication: All the authors approved the publication. Competing interests: The authors declare that they have no competing interests.

Figures

Fig. 1
Fig. 1
PRDX2 Expression and Analysis in Sequencing of TNBC Clinical Samples and Tissues. (A) Flowchart illustrating the PRDX2 staining process in tissues from TNBC patients. The right panel shows the distribution map of tumor (n = 150) and adjacent tissues (n = 30). (B) Immunohistochemical analysis of PRDX2 expression in TNBC tissues. The right panel provides a high-magnification view of the area within the black dashed box; the red dashed box highlights tumor cells with high PRDX2 expression. Scale bars = 20 μm. (C) Statistical bar chart depicting PRDX2 expression levels in tumor and paracancerous tissues of TNBC patients. (D) Differentially expressed genes between tumor and adjacent tissues of TNBC (ER-, PR-, and HER2-) patients, as identified in the TCGA database. Screening criteria:|log2FC| > 1 and P < 0.05. Red indicates high expression, and blue indicates low expression. (E) Venn diagram showing the intersection of upregulated genes and migration/invasion-related genes in tumors of TNBC patients. (F) Heatmap illustrating the correlation between PRDX2 and migration/invasion-related genes in tumor tissues of TNBC patients, based on data from the TCGA database. Red represents positive correlation, and blue represents negative correlation. Data are presented as mean ± standard error (mean ± SEM). P values and significance were determined using two-tailed unpaired t-tests (C). *P ≤ 0.05; **P ≤ 0.01
Fig. 2
Fig. 2
PRDX2 Promotes Migration and Invasion of Breast Cancer Cells. (A) Workflow for lentivirus preparation and transfection of breast cancer cells. The right shows the BF and fluorescence images of MDA-MB-231 and MDA-MB-468 cells. Scale bars = 200 μm. (B) Detection of PRDX2 gene and protein expression in breast cancer cells. (C, D) Analysis of gene and protein expression related to migration, invasion, and epithelial-mesenchymal transition (EMT) in MDA-MB-231 (C) and MDA-MB-468 (D)breast cancer cells. migration Scale bars = 100 μm; invasion Scale bars = 50 μm. (E) Transcriptome sequencing of MDA-MB-231 cells transfected with sh_NC or sh_PRDX2. (F) GO and KEGG enrichment analysis of differentially expressed genes inMDA-MB-231 cells. (G) Venn diagram showing the intersection of differentially expressed genes and genes associated with invasion and metastasis. Data are presented as mean ± standard error of the mean (mean ± SEM). P values and Statistical significance was determined using two-tailed unpaired t-tests (C, D) and one-way ANOVA (B). *P ≤ 0.05; **P ≤ 0.01; ***P ≤ 0.001; ****P ≤ 0.0001
Fig. 3
Fig. 3
PRDX2 Regulates FN1 to Promote Migration and EMT of Breast Cancer Cells. (A-B) mRNA (Bar chart) and protein expression levels of PRDX2, FN1, COL6A2, and ITGB3 in breast cancer cell lines MDA-MB-231 (A) and MDA-MB-468 (B) under conditions of PRDX2 knockdown (sh_PRDX2) compared to negative control (sh_NC). (C-E) The effects of FN1 (C), COL6A2 (D), and ITGB3 (E) knockdown on the migratory capacity of PRDX2-knockdown breast cancer cells (MDA-MB-231), with scale bars = 200 μm. F. The impact of FN1, COL6A2, and ITGB3 knockdown on the expression of EMT markers (E-cadherin, N-cadherin, VIM) and matrix metalloproteinases (MMP3, MMP9) in PRDX2-knockdown breast cancer cells (MDA-MB-231). Data are represented as mean ± standard error of the mean (mean ± SEM). P values and statistical significance was assessed using two-tailed unpaired t-tests (A-B). ns, not significant; *P ≤ 0.05; **P ≤ 0.01; ***P ≤ 0.001
Fig. 4
Fig. 4
Effects of PRDX2 Inhibition on a Mouse Model of Breast Cancer. (A) mouse model of breast cancer with PRDX2 inhibition was established, comprising four groups containing eight mice. (B) Subcutaneous tumor diagrams of the four groups of mice, with the dotted box indicating the tumor location. (C) Statistical plots of subcutaneous tumor volumes for the four groups of mice, with the dashed box highlighting the tumor size. Scale bars = 1 cm. (D) Immunofluorescence (IF) analysis was performed to assess the protein expression levels of PRDX2 (indicated by the yellow dotted box) and FN1 (indicated by the white dotted box) in the tumor tissues of the four groups of mice. Scale bars = 20 μm. (E, F) Immunohistochemical (IHC) staining was conducted to evaluate the protein expression of MMP3 (E)and E-cadherin (F) in the tumor tissues; black arrows denote the locations of positive cell expression. Scalebars = 20 μm. Data are presented as mean ± standard error (mean ± SEM). P values and statistical significance was determined using two-tailed unpaired t-tests (C). *P ≤ 0.05; **P ≤ 0.01; ***P ≤ 0.001
Fig. 5
Fig. 5
PRDX2 Promotes SP1 Binding to the FN1 Promoter via the PI3K/AKT/SP1 Signaling Pathway. (A) Screening and Analysis of Core Transcription Factors Regulating Migration and Invasion Genes. (B, C) Protein Expression Levels of PRDX2 and Core Transcription Factors (c-Jun, p-SP1, p-p65) in Breast Cancer Cells MDA-MB-231 (B) and MDA-MB-468 (C) under SH_NC/PRDX2 Conditions. (D) Top Three Differentially Expressed Genes in MDA-MB-231 Cells Identified by KEGG Enrichment Analysis. (E, F) Protein Expression Levels of PRDX2 and Key Kinases (p-PI3K, p-AKT) as well as Transcription Factor (p-SP1) in Breast Cancer Cells MDA-MB-231 (E) and MDA-MB-468 (F) under NC/sh_PRDX2 Conditions. (G) SP1 Binds to Three Potential Sites in the FN1 Promoter. (H) SP1 Protein Expression Levels Following Transfection with Wild-Type and h-SP1 Overexpression Plasmids in HEK-293 Cells(I) After transfecting wild-type/h-SP1 overexpression plasmids into HEK-293T cells expressing the WT/mutant FN1 promoter, luciferase activity was detected. (J) Immunofluorescence (IF) detection of the expression levels of PRDX2 and SP1 proteins in tumor tissues from four groups of mice, Scale bars = 20 μm.Data are presented as mean ± standard error (mean ± SEM). P values and statistical significance was determined using two-tailed unpaired t-tests (H) and One-Way ANOVA (I). *P ≤ 0.05; **P ≤ 0.01; ***P ≤ 0.001
Fig. 6
Fig. 6
PRDX2 plays a pivotal role in breast cancer invasion and metastasis by activating the PI3K/AKT signaling pathway, subsequently promoting the binding of SP1 to the FN1 promoter

Similar articles

References

    1. Harbeck N, Gnant M. Breast cancer Lancet. 2017;389:1134–50. - PubMed
    1. Goodarzi H, Liu X, Nguyen HC, Zhang S, Fish L, Tavazoie SF. Endogenous tRNA-Derived fragments suppress breast cancer progression via YBX1 displacement. Cell. 2015;161:790–802. - PMC - PubMed
    1. Yin L, Duan JJ, Bian XW, Yu SC. Triple-negative breast cancer molecular subtyping and treatment progress. Breast Cancer Res. 2020;22:61. - PMC - PubMed
    1. Derakhshan F, Reis-Filho JS. Pathogenesis of Triple-Negative breast cancer. Annu Rev Pathol. 2022;17:181–204. - PMC - PubMed
    1. Zou Y, Xie J, Zheng S, Liu W, Tang Y, Tian W, Deng X, et al. Leveraging diverse cell-death patterns to predict the prognosis and drug sensitivity of triple-negative breast cancer patients after surgery. Int J Surg. 2022;107:106936. - PubMed

MeSH terms

LinkOut - more resources