. 2025 Apr 11;23(1):181.
doi: 10.1186/s12964-025-02181-4.

NETs activate the GAS6-AXL-NLRP3 axis in macrophages to drive morphine tolerance

Affiliations

NETs activate the GAS6-AXL-NLRP3 axis in macrophages to drive morphine tolerance

Qingyan Tian et al. Cell Commun Signal. .

Abstract

Background: The development of morphine tolerance presents a major clinical challenge in the effective management of severe pain. This study aims to explore the mechanisms underlying morphine tolerance from a novel perspective, with the ultimate goal of uncovering new insights and identifying promising therapeutic targets for its treatment.

Methods: C57BL/6J mice were used in the tail-flick test to evaluate morphine tolerance. Neutrophils derived from mouse bone marrow were employed to investigate the mechanisms underlying morphine-induced NETs formation. Bone marrow-derived macrophages (BMDMs) were harvested from the femur and tibia to study the role of NETs-induced inflammation in analgesic tolerance. Proinflammatory cytokines were measured using Western blotting and real-time PCR. The levels of NETs and the TLR7/9-NLRP3-related signaling pathway were assessed through Western blotting, real-time PCR, and ELISA. Confocal laser scanning microscopy was utilized to visualize NETs in the dorsal root ganglion (DRG) and in cells.

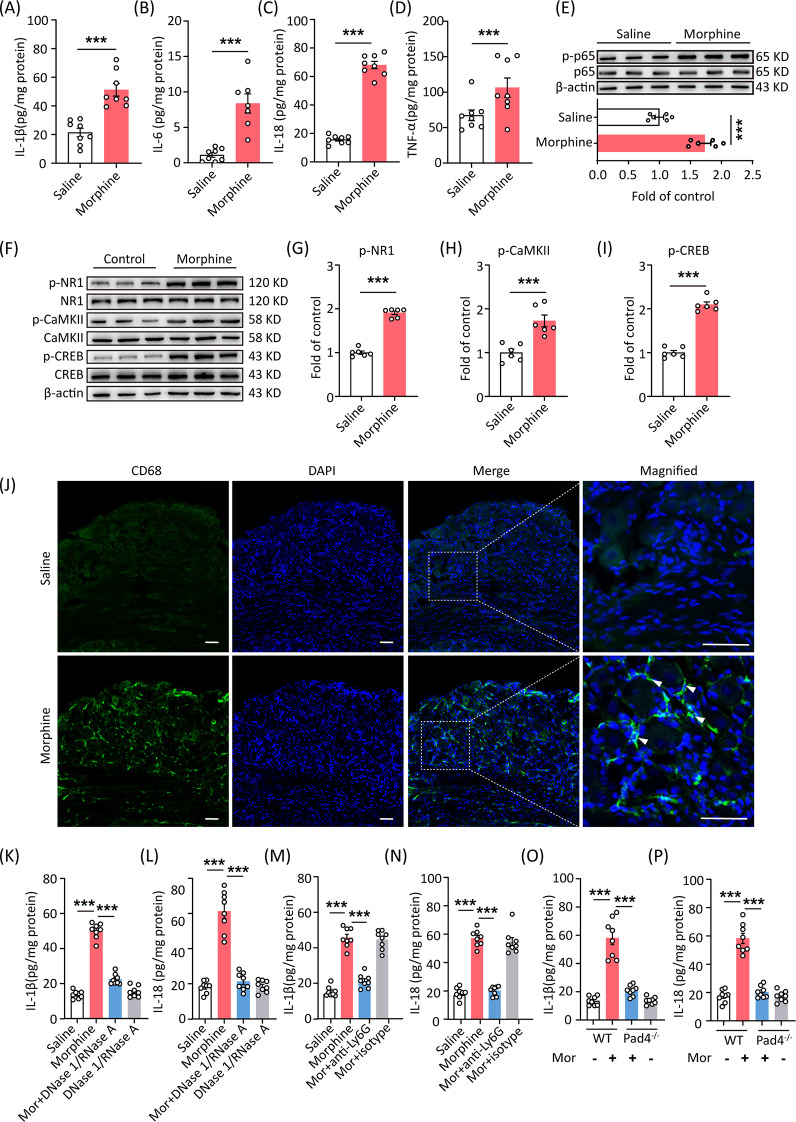
Results: Our experiments demonstrated that the levels of NETs in the plasma of patients using morphine for analgesia, as well as in morphine-tolerant animals, were significantly elevated. Genetic elimination of Pad4, neutrophil depletion, and treatment with DNase 1 and RNase A to disrupt NETs formation all effectively alleviated morphine tolerance. These findings indicate that NETs play a critical role in the development of morphine tolerance. Mechanistically, we discovered that morphine-induced NETs can be engulfed by macrophages through the GAS6-AXL axis, which subsequently triggers the activation of the TLR7/TLR9-mediated NLRP3 inflammasome, leading to significantly increased levels of IL-1β and IL-18, and ultimately contributing to tolerance. Deletion of Axl, Gas6, or Nlrp3 each significantly improved morphine tolerance. Furthermore, in the murine model, treatment with the IL-1 receptor antagonist anakinra and the IL-18 decoy receptor IL-18BP prevented the development of morphine tolerance.

Conclusions: This study identifies morphine-induced NETs as a key contributor to morphine tolerance, with the GAS6-AXL-TLR7/9 axis emerging as a potential therapeutic target. Strategies focused on disrupting NETs and modulating this axis may offer a promising approach to combat morphine tolerance.

Keywords: AXL; GAS6; Morphine tolerance; NETs; NLRP3.


Conflict of interest statement

Declarations. Ethics approval and consent to participate: The studies involving human participants were approved by the Ethics Committee of the First Affiliated Hospital of Nanjing Medical University (approval number: 2023-SR-031). All participants signed informed consent. All animal experiments were conducted according to protocols approved by the Animal Research Ethics Committee of Nanjing Medical University (approval number: IACUC-2203057-1). Consent for publication: Not applicable. Competing interests: The authors declare no competing interests.

Figures

Fig. 1
Fig. 1
NETs play a critical role in morphine tolerance. (A, B) Adult male C57BL/6J mice were subcutaneously injected with morphine (10 mg/kg) for 7 days to induce analgesic tolerance. The tail-flick test was used to evaluate morphine tolerance, and data are presented as the percentage of maximal possible effect (%MPE) (n = 10). (C, D) The content of H3Cit and cfDNA in the plasma of mice was measured on day 7 of morphine treatment using the H3Cit ELISA kit and the Quant-iT PicoGreen dsDNA assay, respectively (n = 8). (E, F) The levels of H3Cit and cfDNA in the plasma of volunteers (n = 9), patients treated without morphine (n = 8), or patients treated with morphine (n = 8) were measured using the H3Cit ELISA kit and the Quant-iT PicoGreen dsDNA assay, respectively. (G) The protein level of H3Cit in the DRG of mice was assessed by western blot on day 7 of morphine treatment (n = 6). (H) Representative immunofluorescence microscopy images of DRG from mice treated with saline or morphine, showing H3Cit (green) and Ly6G (red). (n = 3; Scale bar = 20 μm). (I) Mice were administered 300 µg of anti-mouse Ly6G one day before the initiation of morphine treatment and every 3 days thereafter until day 7. The tail-flick test was performed to evaluate the effect of anti-mouse Ly6G on morphine tolerance. Data are presented as the percentage of maximal possible effect (%MPE) (n = 10). (J) Mice were injected with DNase I (150 U, i.v.) and RNase A (1 mg/kg, i.v.) from the start of morphine treatment until day 7. The tail-flick test was used to assess the effects of DNase I and RNase A on morphine tolerance. Data are presented as the percentage of maximal possible effect (%MPE) (n = 10). (K) WT and Pad4−/− mice were subcutaneously injected with morphine (10 mg/kg) for 7 days. Data are presented as the percentage of maximal possible effect (%MPE) (n = 10). Statistical Analysis: *p < 0.05, **p < 0.001, ***p < 0.0001
Fig. 2
Fig. 2
Morphine triggers NETs formation. (A) NETs formation was examined by scanning electron microscopy following stimulation of neutrophils with LPS (1 µg/mL) (4 h), PMA (500 µM) (4 h), or morphine (20 µM and 200 µM) (24 h). Cells treated with LPS (1 µg/mL) or PMA (500 nM) served as positive controls. (n = 3; Scale bar = 20 μm). (B) Neutrophils derived from mouse bone marrow were stimulated with LPS (1 µg/mL) or PMA (500 nM) for 4 h, or with morphine (20 µM or 200 µM) for 24 h, and then subjected to immunofluorescence staining for NETs: H3Cit (green), MPO (red), and DAPI (blue). White arrows indicate NETs structures. (n = 3; Scale bar = 20 μm). (C, D) Neutrophils were treated with Naloxone (10 µM) or TAK242 (10 µM) for 30 min, followed by exposure to morphine (200 µM) for 12 h. The protein levels of H3Cit were evaluated by western blot. (n = 6). (E, F) Neutrophils were stimulated with morphine (200 µM) for 12 h, and the levels of H3Cit, NE, and PAD4 were evaluated by western blot. (n = 6). Statistical Analysis: *p < 0.05, **p < 0.001, ***p < 0.0001
Fig. 3
Fig. 3
Morphine-induced NETs cause inflammation. (A-D) Adult male C57BL/6J mice were subcutaneously injected with morphine (10 mg/kg) for 7 days. The levels of IL-1β, IL-6, IL-18, and TNF-a in the DRG were evaluated by ELISA on day 7 after the initiation of morphine treatment (n = 8). (E) The level of p-p65(NF-kB) in the DRG was evaluated by western blot on day 7 after the initiation of morphine treatment (n = 6). (F-I) The levels of p-NR1, p-CREB, and p-CaMKII in the spinal cord were evaluated by western blot on day 7 after the initiation of morphine treatment (n = 6). (J) Representative immunofluorescence microscopy images of DRG stained for CD68 (green) and DAPI (blue) on day 7 after the initiation of morphine treatment. The white boxed area shows details of macrophage infiltration in the DRG (white arrow; n = 3; Scale bar = 50 μm). (K-P) The levels of IL-1β and IL-18 in the DRG were analyzed by ELISA on day 7 after the initiation of morphine treatment (n = 8). Statistical Analysis: *p < 0.05, **p < 0.001, ***p < 0.0001
Fig. 4
Fig. 4
The TLR7/TLR9 signaling pathway contributes to inflammation induced by NETs. (A-D) BMDMs were treated with NETs (500 ng/mL) for 3 h. The levels of Il1b, Il6, Il18, and Tnfa mRNA were measured by qPCR (n = 6). (E-G) BMDMs were pretreated with a TLR2 inhibitor (C29, 10 µM), TLR4 inhibitor (TAK242, 10 µM), TLR7 inhibitor (IRS661, 1 µM), TLR8 inhibitor (CU-CPT9a, 10 µM), or TLR9 inhibitor (IRS869, 1 µM) for 1 h, and then treated with NETs (500 ng/mL) for 3 h. The levels of Il1b, Il6, Il18, and Tnfa mRNA were measured by qPCR (n = 6). (H) Adult male C57BL/6J mice were administered TLR7 and TLR9 inhibitors (IRS954, 1 mg/kg, i.p.) 1 day before the initiation of morphine treatment and continued until the end of the 7-day treatment period. MPE was measured every 30 min after morphine injection (n = 10). (I-J) IL-1β and IL-18 levels in the DRG were analyzed by ELISA on day 7 after the initiation of morphine treatment (n = 8). (K) Mice were treated with anakinra (2.5 mg/kg, i.p.) 1 day before morphine administration. MPE was measured every 30 min after morphine injection (n = 10). (L) Mice were treated with IL-18BP (200 µg/kg, i.p.) 1 day before morphine administration. MPE was measured every 30 min after morphine injection (n = 10). (M) Mice were treated with anakinra (2.5 mg/kg, i.p.) or IL-18BP (200 µg/kg, i.p.) 1 day before morphine administration. MPE was measured every 30 min after morphine injection (n = 10). (N-Y) The protein levels of NLRP3, caspase-1(p20), and H3Cit in the DRG were evaluated by western blot on day 7 after the initiation of morphine treatment (n = 6). Statistical Analysis: *p < 0.05, **p < 0.001, ***p < 0.0001
Fig. 5
Fig. 5
NETs-induced activation of the NLRP3 inflammasome contributes to morphine tolerance. (A) NLRP3 inhibitor MCC950 (20 mg/kg, i.p.) was administered 1 day before morphine administration and continued until the end of the 7-day treatment period. MPE was measured every 30 min after morphine injection each day (n = 10). (B, C) IL-1β and IL-18 levels in the DRG were analyzed by ELISA on day 7 after the initiation of morphine treatment (n = 8). (D-F) The protein levels of NLRP3 and caspase-1 (p20) in the DRG were evaluated by western blot on day 7 after the initiation of morphine treatment (n = 6). (G-J) The levels of p-NR1, p-CRER, and p-CaMKII in the spinal cord were evaluated by western blot on day 7 after the initiation of morphine treatment (n = 6). (K) WT and Nlrp3−/− mice were treated with morphine (10 mg/kg) for 7 days to induce analgesic tolerance. MPE was measured every 30 min after morphine injection each day (n = 10). (L, M) IL-1b and IL-18 levels in the DRG were analyzed by ELISA on day 7 after the initiation of morphine treatment (n = 8). (N-O) The protein levels of caspase-1 (p20) in the DRG were evaluated by Western blot on day 7 after the initiation of morphine treatment (n = 6). (P-S) The levels of p-NR1, p-CRER, and p-CaMKII in the spinal cord were evaluated by Western blot on day 7 after the initiation of morphine treatment (n = 6). (T) EPA (1 g/kg, i.g.) was administered by gavage 5 days before morphine treatment and continued until day 7. MPE was measured every 30 min after morphine injection each day (n = 10). (U, V) IL-1β and IL-18 levels in the DRG were analyzed by ELISA on day 7 after the initiation of morphine treatment (n = 8). Statistical Analysis: *p < 0.05, **p < 0.001, ***p < 0.0001
Fig. 6
Fig. 6
The GAS6-AXL axis is involved in NETs-induced activation of macrophages. (A-C) BMDMs were pretreated with an AXL inhibitor (TP-0903, 10 nM) or a MerTK inhibitor (UNC2541, 2.5 µM) for 1 h prior to NETs stimulation. Following pretreatment, the cells were stimulated with NETs for 3 h. The levels of Il1b, Il6, Tnfa, and Il18 mRNA were measured by qPCR (n = 6). (D) WT and Axl−/− mice were treated with morphine (10 mg/kg) for 7 days, and the MPE was measured every 30 min after morphine injection each day (n = 10). (E-L) The levels of p-NR1, p-CRER, and p-CaMKII in the spinal cord and NLRP3 and caspase-1 (p20) in the DRG were evaluated by western blot on day 7 after the initiation of morphine treatment (n = 6). (L, M) IL-1β and IL-18 levels in the DRG were analyzed by ELISA on day 7 after the initiation of morphine treatment (n = 8). (N) WT and Gas6−/− mice were treated with morphine (10 mg/kg) for 7 days to induce morphine tolerance, and the MPE was measured every 30 min after morphine injection each day (n = 10). (O-U) The levels of p-NR1, p-CRER, and p-CaMKII in the spinal cord and NLRP3 and caspase-1 (p20) in the DRG were evaluated by western blot on day 7 after the initiation of morphine treatment (n = 6). (V, W) IL-1β and IL-18 levels in the DRG were analyzed by ELISA on day 7 after the initiation of morphine treatment (n = 8). Statistical Analysis: *p < 0.05, **p < 0.001, ***p < 0.0001
Fig. 7
Fig. 7
Schematic Illustration: Morphine induces the formation of NETs, which are engulfed by macrophages through the GAS6-AXL axis. This process triggers the activation of the TLR7/TLR9-mediated NLRP3 inflammasome, leading to significant increases in IL-1β and IL-18, ultimately contributing to the development of morphine tolerance

Similar articles

References

    1. Corder G, Tawfik VL, Wang D, Sypek EI, Low SA, Dickinson JR, Sotoudeh C, Clark JD, Barres BA, Bohlen CJ, Scherrer G. Loss of Μ opioid receptor signaling in nociceptors, but not microglia, abrogates morphine tolerance without disrupting analgesia. Nat Med. 2017;23:164–73. - PMC - PubMed
    1. Mischel RA, Dewey WL, Akbarali HI. Tolerance to Morphine-Induced Inhibition of TTX-R Sodium Channels in Dorsal Root Ganglia Neurons Is Modulated by Gut-Derived Mediators. iScience 2018, 2:193–209. - PMC - PubMed
    1. Graczyk M, Krajnik M, Woroń J, Wordliczek J, Malec-Milewska M. Use of opioids as one of the causes of fever in patients with advanced cancer. Int J Immunopathol Pharmacol. 2017;30:98–104. - PMC - PubMed
    1. Breslow JM, Monroy MA, Daly JM, Meissler JJ, Gaughan J, Adler MW, Eisenstein TK. Morphine, but not trauma, sensitizes to systemic acinetobacter baumannii infection. J Neuroimmune Pharmacol. 2011;6:551–65. - PMC - PubMed
    1. Liu Y, Song R, Lu Z, Zhao L, Zhan X, Li Y, Cao X. The RNA m(6)A demethylase ALKBH5 drives emergency granulopoiesis and neutrophil mobilization by upregulating G-CSFR expression. Cell Mol Immunol. 2024;21:6–18. - PMC - PubMed

Substances

LinkOut - more resources