

Epitranscriptomic analysis reveals clinical and molecular signatures in glioblastoma
- PMID: 40217422
- PMCID: PMC11987271
- DOI: 10.1186/s40478-025-01966-5
Epitranscriptomic analysis reveals clinical and molecular signatures in glioblastoma
Abstract
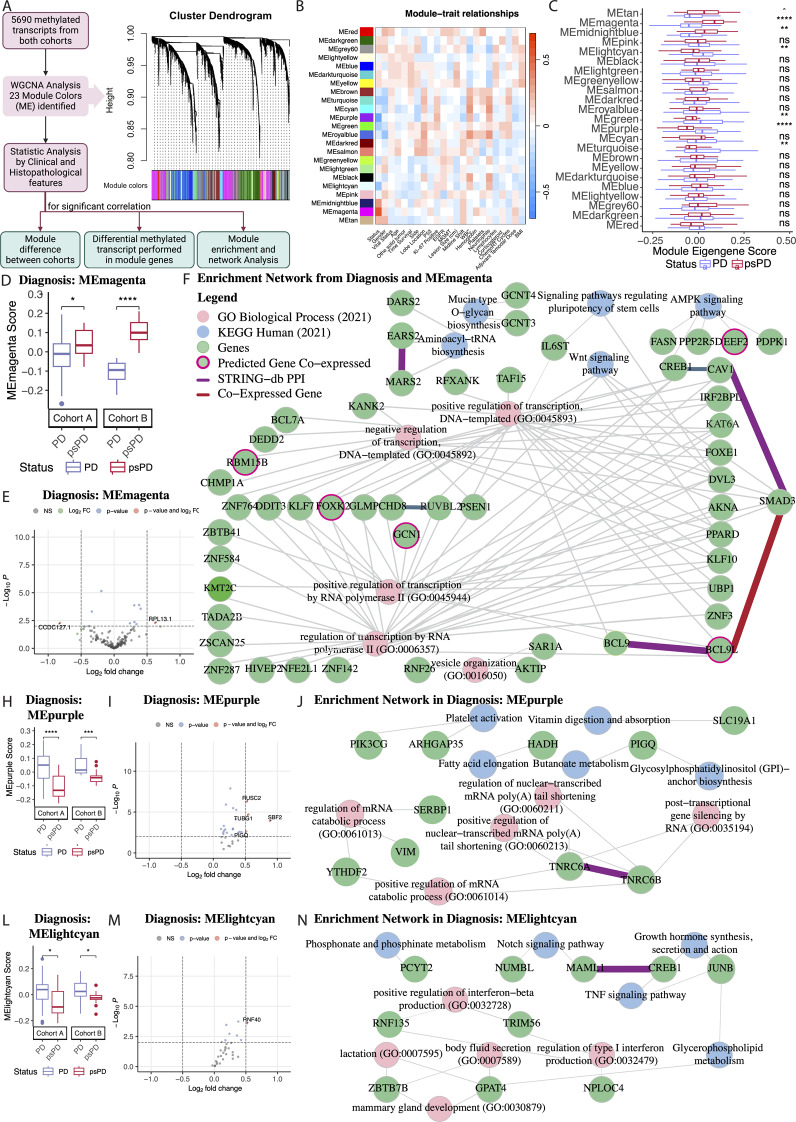
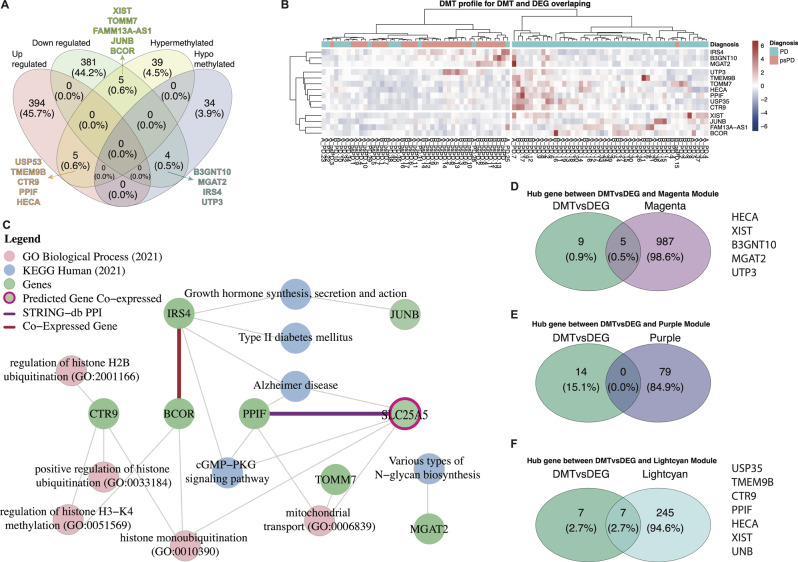
This study characterizes the glioblastoma (GB) epitranscriptomic landscape in patient who evolve to progressive disease (PD) or pseudo-progressive disease (psPD). Novel differences in N6-Methyladenosine (m6A) RNA methylation patterns between these groups are identified in the first biopsy. Retrospective data of patients that were eventually deemed to have progressive disease or pseudoprogressive disease was captured from the electronic health record, and RNA from the first resection specimen was utilized to evaluate N6-methyladenosine (m6A) biomarkers from FFPE samples. Molecular analysis of m6A methylation modified RNA employed ACA-based RNase MazF digestion. After Quantitative Normalization with ComBat to mitigate batch effects, we identifed differentially methylated transcripts and gene expression analyses, co-expression networks analyses with WGCNA, and subsequently performed gene set GO and KEGG enrichment analyses. Enrichments for metabolic biological processes and pathways were identified in our differential methylated transcripts and select module eigengene networks highlighted key co-expressed genes intricately tied to distinct phenotypes/traits in patients that would ultimately be deemed PD or psPD. Our study identified key genes and pathways modified by m6A RNA methylation associated with cell metabolism alterations, highlighting the importance of understanding m6A mechanisms leading to the oncometabolite accumulation governing PD versus psPD patients. Furthermore, these data indicate that epitranscriptomal differences between PD versus psPD are detected early in the disease course.
Keywords: Epitranscriptome; Glioblastoma; Novel enhancement; Progression disease; Pseudo-progression.
© 2025. The Author(s).
Conflict of interest statement
Declarations. Ethics approval and consent to participate: All studies were conducted with the approval of the The Ohio State University (IRB study number 2020C0062). Consent for publication: All authors have approved the manuscript and agree with its submission. Competing interests: The authors declare that they have no competing interests.
Figures


Similar articles
-
N6-methyladenosine methylation regulators can serve as potential biomarkers for endometriosis related infertility.Biomol Biomed. 2025 May 8;25(7):1540-1552. doi: 10.17305/bb.2024.11311. Biomol Biomed. 2025. PMID: 39739380 Free PMC article.
-
O-GlcNAcylation stabilized WTAP promotes GBM malignant progression in an N6-methyladenosine-dependent manner.Neuro Oncol. 2025 May 15;27(4):900-915. doi: 10.1093/neuonc/noae268. Neuro Oncol. 2025. PMID: 39671515
-
Clinical and prognostic significance of m6A hypomethylation and IGF2BP3 overexpression in gastric cancer: an integrated epigenomic-transcriptomic analysis.Hum Genomics. 2025 Aug 22;19(1):95. doi: 10.1186/s40246-025-00802-0. Hum Genomics. 2025. PMID: 40847370 Free PMC article.
-
Treatment options for progression or recurrence of glioblastoma: a network meta-analysis.Cochrane Database Syst Rev. 2021 May 4;5(1):CD013579. doi: 10.1002/14651858.CD013579.pub2. Cochrane Database Syst Rev. 2021. PMID: 34559423 Free PMC article.
-
Systemic pharmacological treatments for chronic plaque psoriasis: a network meta-analysis.Cochrane Database Syst Rev. 2021 Apr 19;4(4):CD011535. doi: 10.1002/14651858.CD011535.pub4. Cochrane Database Syst Rev. 2021. Update in: Cochrane Database Syst Rev. 2022 May 23;5:CD011535. doi: 10.1002/14651858.CD011535.pub5. PMID: 33871055 Free PMC article. Updated.
References
-
- Ashburner M, Ball CA, Blake JA, Botstein D, Butler H, Cherry JM, Davis AP, Dolinski K, Dwight SS, Eppig JT, Harris MA, Hill DP, Issel-Tarver L, Kasarskis A, Lewis S, Matese JC, Richardson JE, Ringwald M, Rubin GM, Sherlock G (2000) Gene ontology: tool for the unification of biology. The gene ontology consortium. Nat Genet 25:25–29. 10.1038/75556 - PMC - PubMed
-
- Barbaro M, Blinderman CD, Iwamoto FM, Kreisl TN, Welch MR, Odia Y, Donovan LE, Joanta-Gomez AE, Evans KA, Lassman AB (2022) Causes of death and End-of-Life care in patients with intracranial High-Grade gliomas: A retrospective observational study. Neurology 98:e260–e266. 10.1212/WNL.0000000000013057 - PMC - PubMed
-
- Blighe KRS, Lewis M (2023) EnhancedVolcano: Publication-ready volcano plots with enhanced colouring and labeling. 10.18129/B9.bioc.EnhancedVolcano
Publication types
MeSH terms
Substances
Grants and funding
- R03NS116334/NS/NINDS NIH HHS/United States
- R01HL163965-01/National Institute of Health/ National Heart, Lung, and Blood Institute (NIH/NHLBI)
- P30CA016058/The Ohio State University Comprehensive Cancer Center Bioinformatics Shared Resource and Genomics Shared Resource supported by the National Cancer Institute (NCI, US)
- TL1TR002735/Ohio State University-Translational Data Analytics Institute (OSU-TDAI) seed grant (US)
- UL1TR002733/National Center for Advancing Translational Sciences (NCATS, US)
- GF314420/James Cancer Center - Neuro-Oncology Novel Therapies and Research Fund (US)
- R03 NS116334/NS/NINDS NIH HHS/United States
- R01 HL163965/HL/NHLBI NIH HHS/United States
- P30 CA016058/CA/NCI NIH HHS/United States
- TL1 TR002735/TR/NCATS NIH HHS/United States
- UL1 TR002733/TR/NCATS NIH HHS/United States
LinkOut - more resources
Full Text Sources
Medical
