

Quantitative evaluation of parotid gland dysfunction in patients with hyposalivation using magnetic resonance imaging mapping technique : Quantification of Parotid gland function using MRI
- PMID: 40217449
- PMCID: PMC11987458
- DOI: 10.1186/s12903-025-05873-y
Quantitative evaluation of parotid gland dysfunction in patients with hyposalivation using magnetic resonance imaging mapping technique : Quantification of Parotid gland function using MRI
Abstract
Objective: This study aimed to assess the feasibility of quantitative magnetic resonance imaging (MRI) employing the multi-dynamic multi-echo (MDME) technique as a diagnostic modality for evaluating glandular dysfunction in patients with hyposalivation.
Methods: The MDME technique generated T1, T2, and proton density (PD) maps of the parotid gland, allowing for the simultaneous acquisition of values from the respective mappings. The Mann-Whitney U-test was used to compare the hyposalivation and control groups, and receiver operating characteristic (ROC) curve analysis was performed.
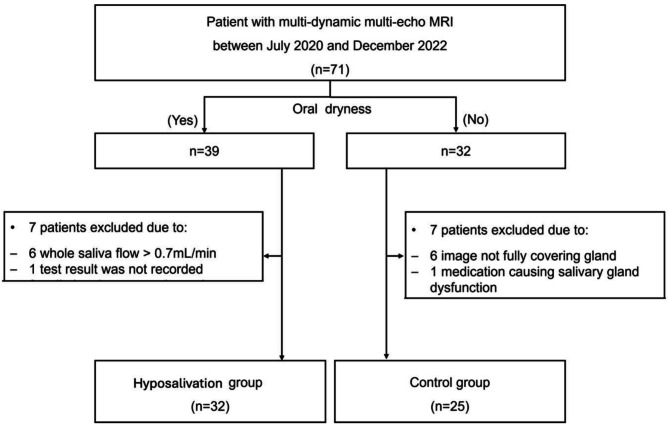
Results: A total of 71 patients who underwent MDME MRI were reviewed and categorized into hyposalivation patients (n = 32) and healthy controls (n = 25). The average T1, T2 and PD value of the gland in the hyposalivation group were 606.92 ms, 91.85 ms, and 82.52 pu, respectively, whereas those in the control group were 628.08 ms, 80.69 ms, and 91.12 pu, respectively. The T2 and PD values were significantly different between the hyposalivation and control groups. The cut-off T2 value was 85.75 ms (AUC = 0.8131, p < 0.0001) and the cut-off PD value was 81.55 pu (AUC = 0.7588, p = 0.0009).
Conclusions: T2 and PD values derived from the MDME technique demonstrated strong potential for detecting parotid gland dysfunction in hyposalivation patients. These findings suggest that MDME-based quantitative MRI mapping shows promise in evaluating hyposalivation of the parotid gland and could become a valuable diagnostic tool in clinical settings.
Keywords: Dry mouth; Hyposalivation; Magnetic resonance imaging; Multi-dynamic multi-echo sequence; Relaxation map; Salivary gland.
© 2025. The Author(s).
Conflict of interest statement
Declarations. Ethics approval and consent to participate: Owing to the retrospective nature of this study, the requirement for informed consent was waived by the Institutional Review Board of Yonsei University Dental Hospital. This study was approved by the Institutional Review Board of the Yonsei University Dental Hospital and was conducted in accordance with the relevant guidelines and ethical regulations. Consent for publication: Not applicable, as no identifiable personal data is included in the manuscript. Conflict of interest: The authors have no potential conflicts of interest to disclose.
Figures


Similar articles
-
Quantitative Analysis of Parotid Gland Secretion Function in Sjögren's Syndrome Patients with Dynamic Magnetic Resonance Sialography.Korean J Radiol. 2019 Mar;20(3):498-504. doi: 10.3348/kjr.2018.0508. Korean J Radiol. 2019. PMID: 30799581 Free PMC article.
-
[The value of relaxation time quantitative technique from synthetic magnetic resonance imaging in the diagnosis and invasion assessment of prostate cancer].Zhonghua Yi Xue Za Zhi. 2022 Apr 19;102(15):1093-1099. doi: 10.3760/cma.j.cn112137-20211018-02304. Zhonghua Yi Xue Za Zhi. 2022. PMID: 35436808 Chinese.
-
Evaluation of parotid gland function using equivalent cross-relaxation rate imaging applied magnetization transfer effect.J Radiat Res. 2012;53(1):138-44. doi: 10.1269/jrr.11059. J Radiat Res. 2012. PMID: 22302054
-
[Evaluation of the Accuracy of Relaxation Time Measurements Using 3D-QALAS at 3.0 T MRI and Comparison with 2D-MDME].Nihon Hoshasen Gijutsu Gakkai Zasshi. 2023 Jul 20;79(7):663-673. doi: 10.6009/jjrt.2023-1343. Epub 2023 May 19. Nihon Hoshasen Gijutsu Gakkai Zasshi. 2023. PMID: 37211403 Japanese.
-
Multispectral quantitative magnetic resonance imaging of brain iron stores: a theoretical perspective.Top Magn Reson Imaging. 2006 Feb;17(1):19-30. doi: 10.1097/01.rmr.0000245460.82782.69. Top Magn Reson Imaging. 2006. PMID: 17179894 Review.
References
-
- Navazesh M, Kumar SK. Measuring salivary flow: challenges and opportunities. J Am Assoc. 2008;139:S35–40. - PubMed
MeSH terms
Grants and funding
LinkOut - more resources
Full Text Sources
Medical
