

Genome-wide identification and analysis of the apple H+-ATPase gene family and its expression against iron deficiency stress
- PMID: 40217534
- PMCID: PMC11987411
- DOI: 10.1186/s12870-025-06501-1
Genome-wide identification and analysis of the apple H+-ATPase gene family and its expression against iron deficiency stress
Abstract
Background: Iron (Fe) is indispensable to plants, playing a significant role in life activities such as respiration, chlorophyll biosynthesis, and photosynthetic electron transport. The decrease in pH caused by iron deficiency is related to the activation of H+-ATPase in the root plasma membrane, although the reaction mechanism of this enzyme is not well understood in apples. The H+-ATPase (HA) gene family has been extensively studied in Arabidopsis but is rarely reported in other species.
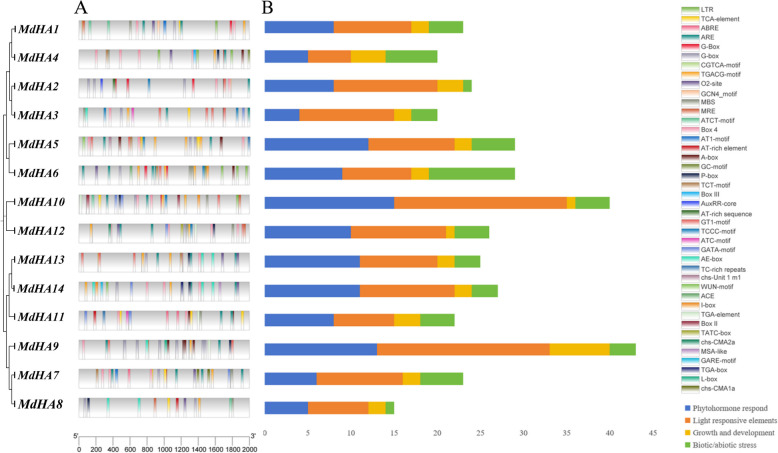
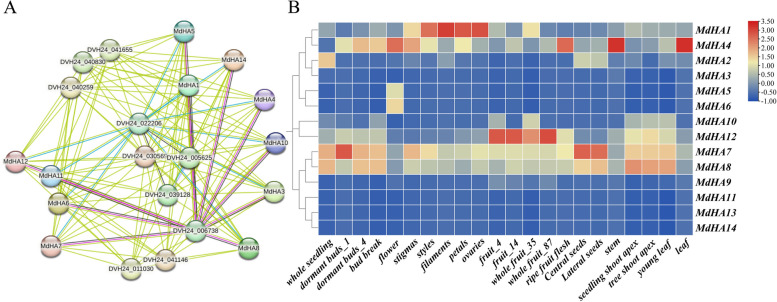
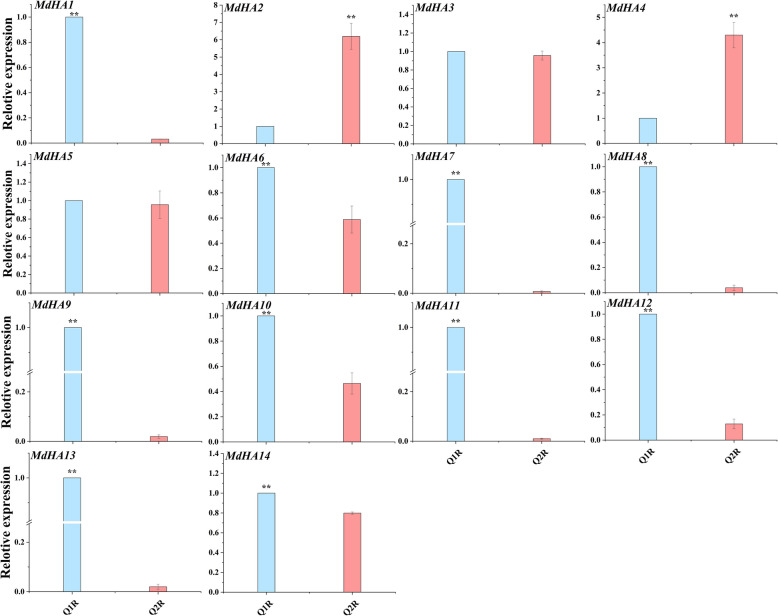
Results: In this study, 14 HA genes were identified from the apple genome database through whole genome analysis. These apple H+-ATPase (MdHAs) genes were classified into four subsets (I, II, IV, V) based on phylogenetic analysis. Bioinformatics analysis revealed that these genes exhibited diversity in gene structure, chromosomal distribution, conserved motifs, and cis-acting elements. The qRT-PCR analysis revealed that iron deficiency stress significantly induced the upregulation of nine MdHA genes (MdHA5-MdHA14). Furthermore, in the roots of iron deficiency-resistant rootstock variety QZ1 compared to the non-resistant variety QZ2, the expression levels of nine genes (including MdHA1, MdHA6-MdHA13) in QZ2 were significantly lower than those in QZ1. This study lays a foundation for further study on the function of HA gene family.
Conclusions: These findings suggest that the HA gene family is involved in the apple's response to iron deficiency. This study not only lays the groundwork for future research but also highlights the role of MdHAs in iron stress tolerance.
Keywords: H + -ATPase gene family; Apple; Genome - wide identification; Iron deficiency stress.
© 2025. The Author(s).
Conflict of interest statement
Declarations. Ethics approval and consent to participate: Not applicable. Consent for publication: Not applicable. Competing interests: The authors declare no competing interests.
Figures


Similar articles
-
Genome-Wide Identification and Analysis of P-Type Plasma Membrane H+-ATPase Sub-Gene Family in Sunflower and the Role of HHA4 and HHA11 in the Development of Salt Stress Resistance.Genes (Basel). 2020 Mar 27;11(4):361. doi: 10.3390/genes11040361. Genes (Basel). 2020. PMID: 32230880 Free PMC article.
-
MxMPK6-2-mediated phosphorylation enhances the response of apple rootstocks to Fe deficiency by activating PM H+ -ATPase MxHA2.Plant J. 2023 Oct;116(1):69-86. doi: 10.1111/tpj.16360. Epub 2023 Jun 29. Plant J. 2023. PMID: 37340905
-
Genome-wide survey of chlorophyllase (CLH) gene family in seven Rosaceae and functional characterization of MdCLH1 in apple (Malus domestica) leaf photosynthesis.Plant Physiol Biochem. 2025 Feb;219:109387. doi: 10.1016/j.plaphy.2024.109387. Epub 2024 Dec 4. Plant Physiol Biochem. 2025. PMID: 39647228
-
Genome-wide analysis of the bZIP gene lineage in apple and functional analysis of MhABF in Malus halliana.Planta. 2021 Sep 18;254(4):78. doi: 10.1007/s00425-021-03724-y. Planta. 2021. PMID: 34536142
-
Genome-wide identification and analysis of the SBP-box family genes in apple (Malus × domestica Borkh.).Plant Physiol Biochem. 2013 Sep;70:100-14. doi: 10.1016/j.plaphy.2013.05.021. Epub 2013 May 25. Plant Physiol Biochem. 2013. PMID: 23771035
References
-
- Kobayashi, Nishizawa NK. Iron uptake, translocation, and regulation in higher plants. Annu Rev Plant Biol. 2012;63(-):131–152. - PubMed
-
- Li J, Guo Y, Yang YQ. The molecular mechanism of plasma membrane H+-ATPases in plant responses to abiotic stress. J Genet Genom. 2022;8:715–25. - PubMed
-
- Morth JP, Pedersen BP, Buch-Pedersen MJ, Andersen JP, Vilsen B, Palmgren MG, Nissen P. A structural overview of the plasma membrane Na+, K+-ATPase and H+-ATPase ion pumps. Nat Rev Mol Cell Biol. 2011;12(1):60–70. - PubMed
MeSH terms
Substances
Grants and funding
- 22ZD6NA045/Science and Technology Major Project of Gansu Province
- 22ZD6NA045/Science and Technology Major Project of Gansu Province
- 22ZD6NA045/Science and Technology Major Project of Gansu Province
- 22ZD6NA045/Science and Technology Major Project of Gansu Province
- 22ZD6NA045/Science and Technology Major Project of Gansu Province
LinkOut - more resources
Full Text Sources
Research Materials
Miscellaneous
