. 2025 Apr 11;15(1):43.
doi: 10.1186/s13578-025-01383-0.

The influence of SARS-CoV-2 spike protein exposure on retinal development in the human retinal organoids

Affiliations

The influence of SARS-CoV-2 spike protein exposure on retinal development in the human retinal organoids

Jing Gong et al. Cell Biosci. .

Abstract

Background: Pregnant women are considered a high-risk population for severe acute respiratory syndrome coronavirus 2 (SARS-CoV-2) infection, as the virus can infect the placenta and embryos. Recently, SARS-CoV-2 has been widely reported to cause retinal pathological changes and to infect the embryonic retina. The infection of host cells by SARS-CoV-2 is primarily mediated through spike (S) protein, which also plays a crucial role in the pathogenesis of SARS-CoV-2. However, it remains poorly understood how the S protein of SARS-CoV-2 affects retinal development, and the underlying mechanism has not yet been clarified.

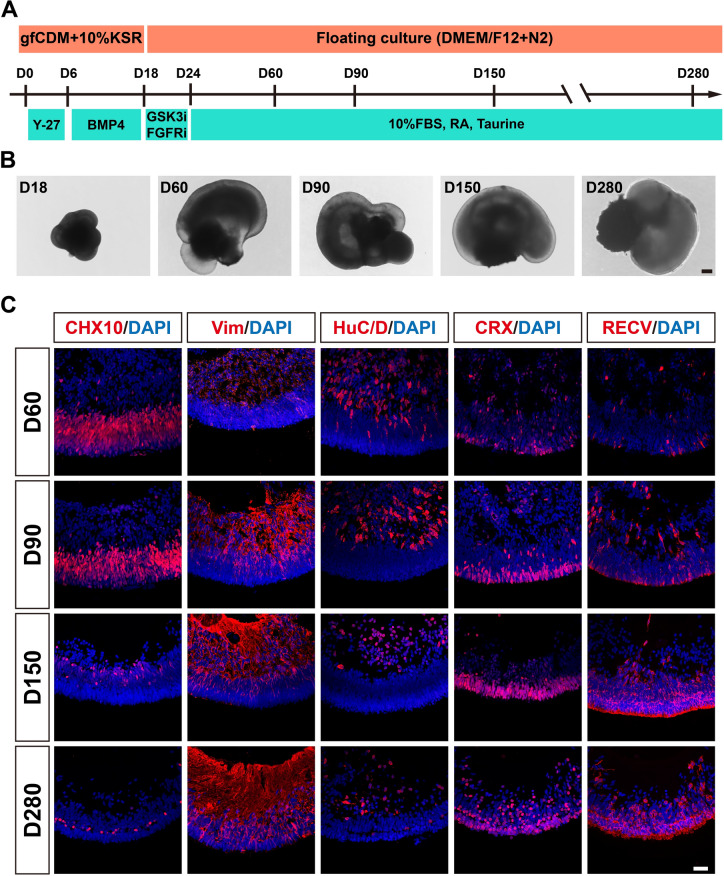
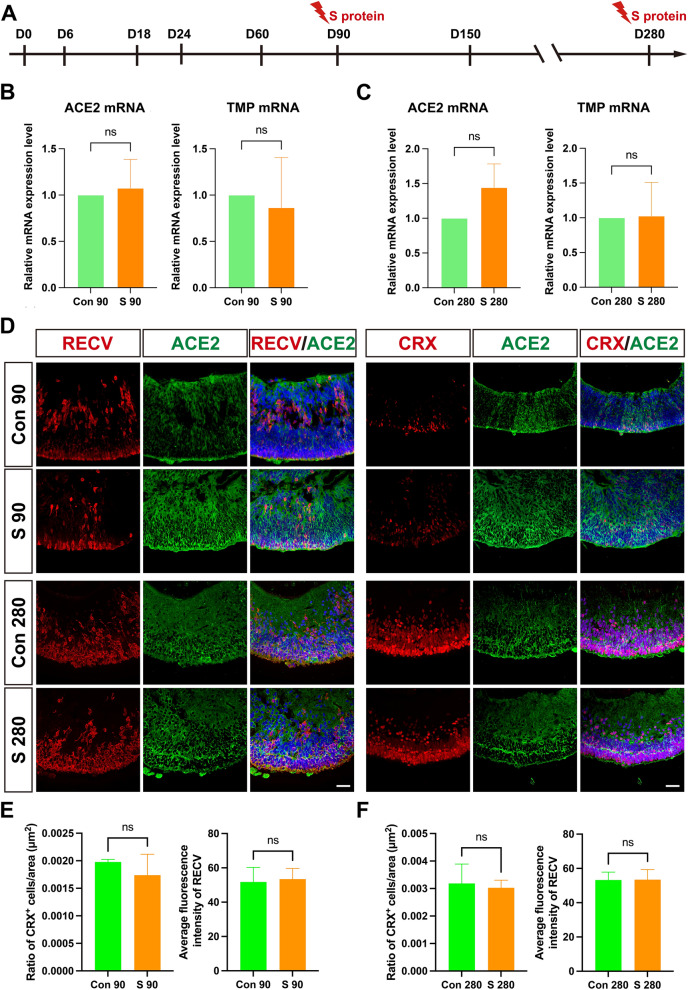
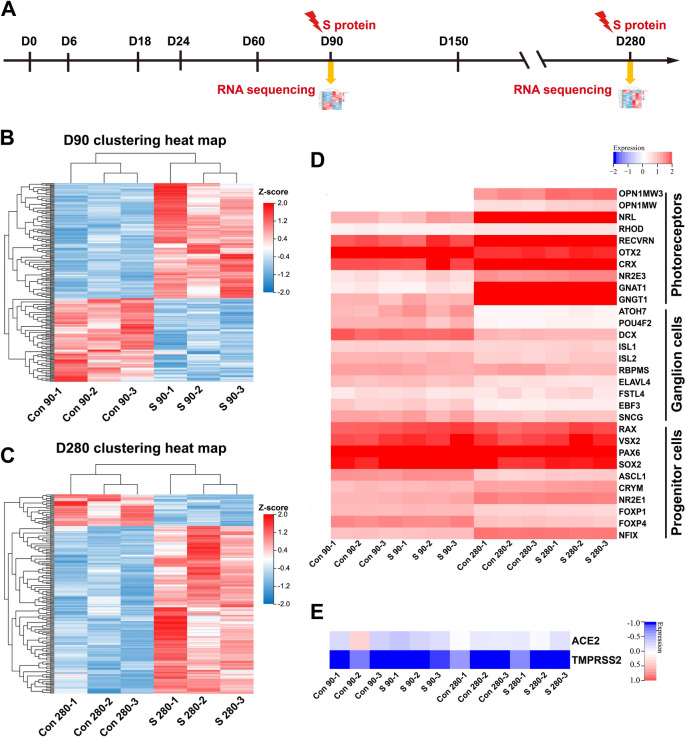
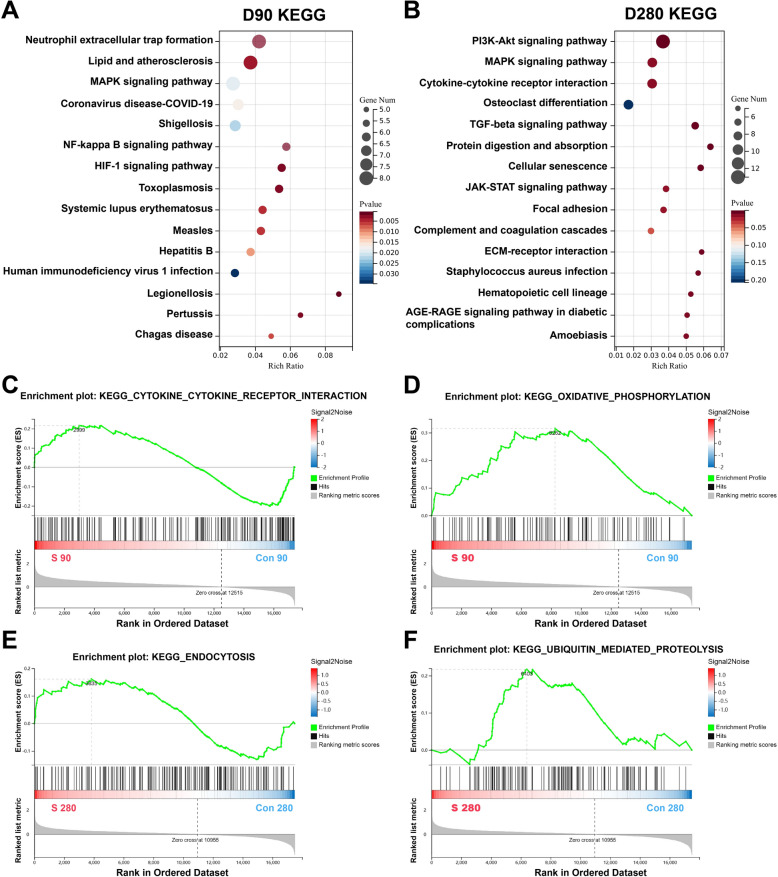
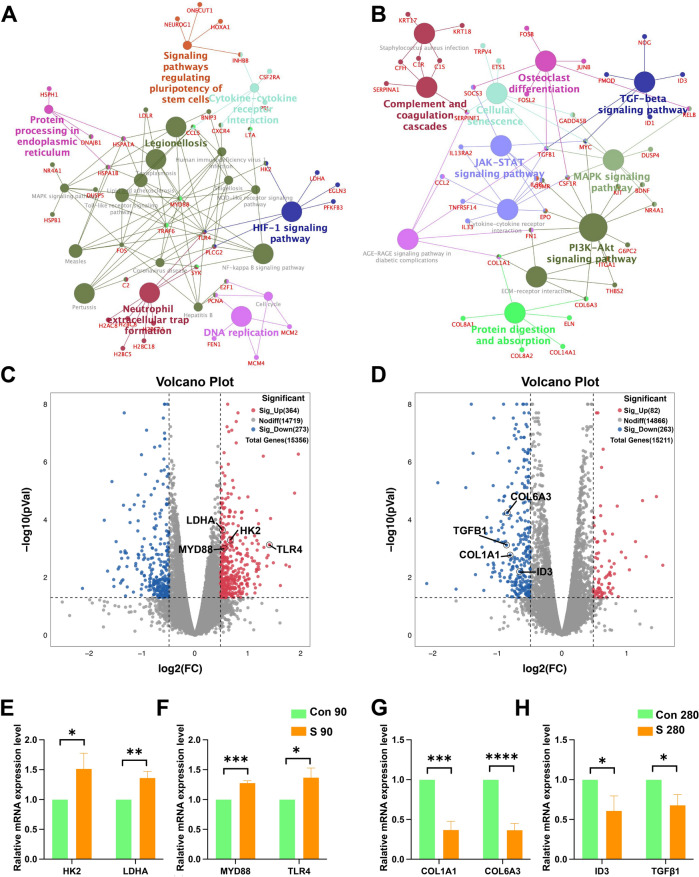
Methods: We used human embryonic stem cell-derived retinal organoids (hEROs) as a model to study the effect of S protein exposure at different stages of retinal development. hEROs were treated with 2 μg/mL of S protein on days 90 and 280. Immunofluorescence staining, RNA sequencing, and RT-PCR were performed to assess the influence of S protein exposure on retinal development at both early and late stages.

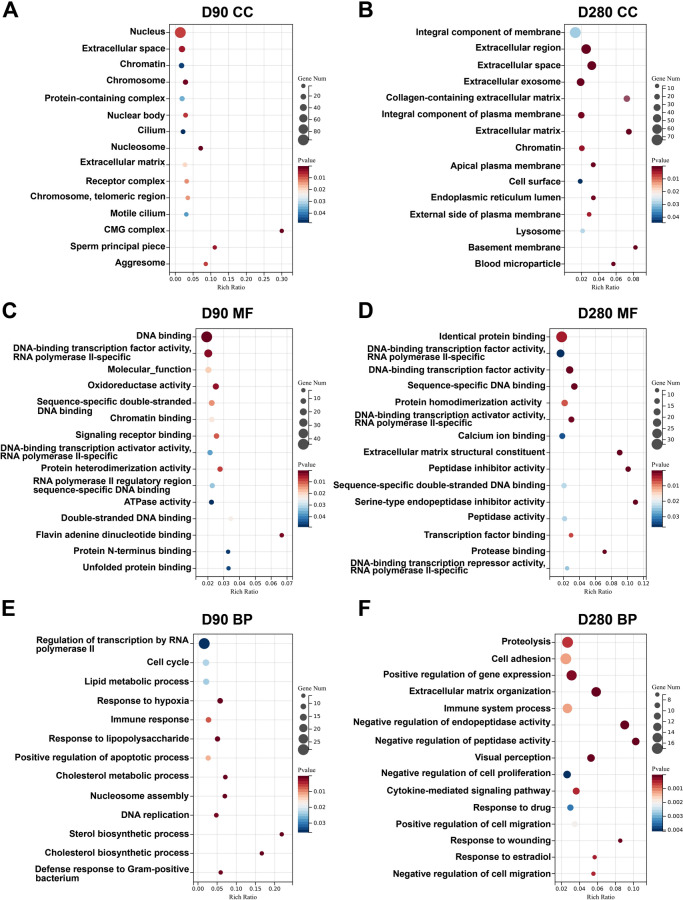
Results: The results showed that ACE2 and TMPRSS2, the receptors facilitating SARS-CoV-2 entry into host cells, were expressed in hEROs. Exposure to the S protein induced an inflammatory response in both the early and late stages of retinal development in the hEROs. Additionally, RNA sequencing indicated that early exposure of the S protein to hEROs affected nuclear components and lipid metabolism, while late-stages exposure resulted in changes to cell membrane components and the extracellular matrix.

Conclusion: This work highlights the differential effects of SARS-CoV-2 S protein exposure on retinal development at both early and late stages, providing insights into the cellular and molecular mechanisms underlying SARS-CoV-2-induced developmental impairments in the human retina.

Keywords: Retinal development; Retinal organoid; SARS-CoV-2; Spike protein.


Conflict of interest statement

Declarations. Ethics approval and consent to participate: Not applicable. Consent for publication: Not applicable. Competing interests: The authors declare that they have no competing interests.

Figures

Fig. 1
Fig. 1
Generation and identification of hEROs in vitro. A Schematic of the hEROs self-organization protocol. B Bright-field view showing the representative images of hEROs at days 18, 60, 90, 150, and 280. Scale bar, 100 μm. C Immunostaining of hEROs at days 18, 60, 90, 150, and 280 for CHX10+, Vimentin (Vim)+, HuC/D+, CRX+, and Recoverin (RECV)+ cells. Scale bar, 50 μm
Fig. 2
Fig. 2
Expression of SARS-CoV-2 receptor in hEROs during embryonic retinal development. A The relative mRNA expression of ACE2 and TMPRSS2 (TMP) in hECSs (ES) and hEROs (D60, D90, D150, and D280). B Representative images of the expression of ACE2+ and TMP+ cells at day 60, 90, 150, and 280 by immunofluorescence staining. Scale bar, 50 μm. Data are presented as means ± SD. ***P < 0.001, ****P < 0.0001
Fig. 3
Fig. 3
The influence of the SARS-CoV-2 S protein exposure on the development of hEROs. A Schematic of S protein treatment of hEROs at different points. B The relative mRNA levels of ACE2 and TMP in hEROs at day 90 after S protein exposure, compared to control groups . C The relative mRNA levels of ACE2 and TMP in hEROs at day 280 after S protein exposure, compared to control groups . D Representative images of the expression of RECV+/ACE2+ cells and CRX+/ACE2+ cells in hEROs at days 90 and 280 after S protein exposure. E The ratio of CRX-positive cells/ area (μm2) and the average fluorescence intensity of RECV- positive cells in 90-day hEROs after S protein exposure, compared to control groups . F The ratio of CRX-positive cells/ area (μm2) and the average fluorescence intensity of RECV- positive cells in 280-day hEROs after S protein exposure, compared to control groups. Data are presented as means ± SD. Scale bar, 50 μm
Fig. 4
Fig. 4
RNA sequencing analysis of the influence of S protein exposure on hEROs on days 90 and 280. A Schematic of the RNA sequencing protocol for S protein treatment of hEROs. B The hierarchical clustering heatmap of the control and S protein treatment groups on day 90. C The hierarchical clustering heatmap of the control and S protein treatment groups on day 280. D The hierarchical clustering heatmap of genes associated with photoreceptors, retinal ganglion cells, and progenitor cells in hEROs on days 90 and 280 for both groups, respectively. E The hierarchical clustering heatmap showed the expression of the SARS-CoV-2 receptor ACE2 and TMPRSS2 in hEROs on days 90 and 280 for both groups, respectively
Fig. 5
Fig. 5
S protein exposure exhibits different effects on retinal development at different stages. A Enriched GO terms in CC category in  90-day hEROs after S protein exposure, compared to control groups. The statistically significant enriched GO terms were ranked by gene numbers. B Enriched GO terms in CCs category in 280-day hEROs after S protein exposure, compared to control groups. The statistically significant enriched GO terms were ranked by gene numbers. C Enriched GO terms in MF category in 90-day hEROs after S protein exposure, compared to control groups. The statistically significant enriched GO terms were ranked by gene numbers. D Enriched GO terms in MF category in 280-day hEROs after S protein exposure, compared to control groups. The statistically significant enriched GO terms were ranked by gene numbers. E Enriched GO terms in BP category in  90-day hEROs after S protein exposure, compared to control groups. The statistically significant enriched GO terms were ranked by gene numbers. F Enriched GO terms in BP category in 280-day hEROs after S protein exposure, compared to control groups. The statistically significant enriched GO terms were ranked by gene numbers
Fig. 6
Fig. 6
S protein exposure disrupts retinal development at different stages. A The enrichment of KEGG pathways in 90-day hEROs after S protein exposure, compared to control groups. The statistically significant enriched KEGG pathways were ranked by gene numbers. B The enrichment of KEGG pathways in 280-day hEROs after S protein exposure, compared to control groups. The statistically significant enriched KEGG pathways were ranked by gene numbers. C, D GSEA analysis shows the enrichment of gene sets associated with cytokine receptor interaction and oxidative phosphorylation in 90-day hEROs after S protein exposure, compared to control groups. E, F GSEA analysis shows the enrichment of gene sets associated with endocytosis and ubiquitin mediated proteolysis in 280-day hEROs after S protein exposure, compared to control groups
Fig. 7
Fig. 7
S protein exposure shows the influences of retinal development at the molecular levels. A The  KEGG pathway signaling interaction network of the DEGs in 90-day hEROs after S protein exposure, compared to control groups. B The KEGG pathway signaling interaction network of the DEGs in 280-day hEROs after S protein exposure, compared to control groups. C Volcano plot shows the DEGs of S protein exposure in hEROs at day 90, compared to control groups. D Volcano plot shows the DEGs of S protein exposure in hEROs at day 280, compared to control groups. E, F The relative mRNA expression level of HK2, LDHA, MYD88, and TLR4 in 90-day hEROs  after S protein exposure, compared to control groups. G, H The relative mRNA expression level of COL1A1, COL6A3, ID3, and TGFβ1 in 280-day hEROs  after S protein exposure, compared to control groups. Data are presented as means ± SD. *P < 0.05, **P < 0.01, ***P < 0.001, ****P < 0.0001

Similar articles

References

    1. Maccio U, Zinkernagel AS, Shambat SM, Zeng X, Varga Z. SARS-CoV-2 leads to a small vessel endotheliitis in the heart. EBioMedicine. 2021;63(8):103182. - PMC - PubMed
    1. Song ER, Zhang C, Israelow B, Lu-Culligan A, Prado AV, Skriabine S, Lu PW, Weizman O-E, Liu FM, Dai YL, et al. Neuroinvasion of SARS-CoV-2 in human and mouse brain. J Exp Med. 2021;218(3): e20202135. - PMC - PubMed
    1. Saeed U, Piracha ZZ, Uppal SR, Waheed Y, Uppal R. SARS-CoV-2 induced hepatic injuries and liver complications. Front Cell Infect Mi. 2022;12:726263. - PMC - PubMed
    1. Leftwich HK, Vargas-Robles D, Rojas-Correa M, Yap YR, Bhattarai S, Ward DV, Fujimori G, Forconi CS, Yeboah T, Carter A, et al. The microbiota of pregnant women with SARS-CoV-2 and their infants. Microbiome. 2023;11(1):141. - PMC - PubMed
    1. Montano M, Victor AR, Griffin DK, Duong T, Bolduc N, Farmer A, Garg V, Hadjantonakis AK, Coates A, Barnes FL, et al. SARS-CoV-2 can infect human embryos. Sci Rep. 2022;12(1):15451. - PMC - PubMed

LinkOut - more resources