. 2025 Apr 22;97(15):8182-8188.
doi: 10.1021/acs.analchem.4c05402. Epub 2025 Apr 11.

Chemometrics-Assisted Enhancement of Electrochemical Biosensor Performance toward miRNA Detection

Affiliations

Chemometrics-Assisted Enhancement of Electrochemical Biosensor Performance toward miRNA Detection

Wanda Cimmino et al. Anal Chem. .

Abstract

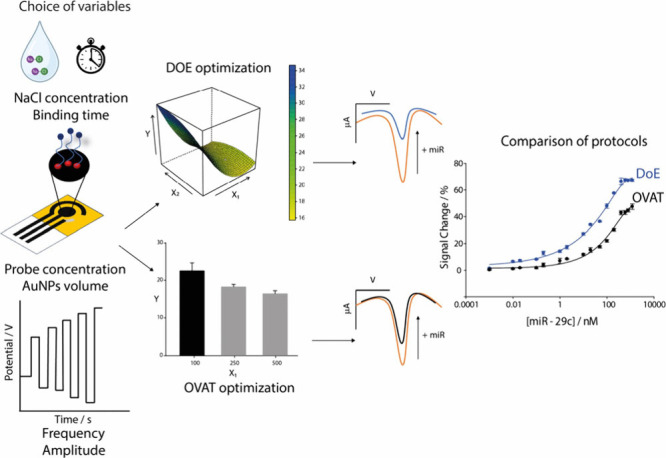
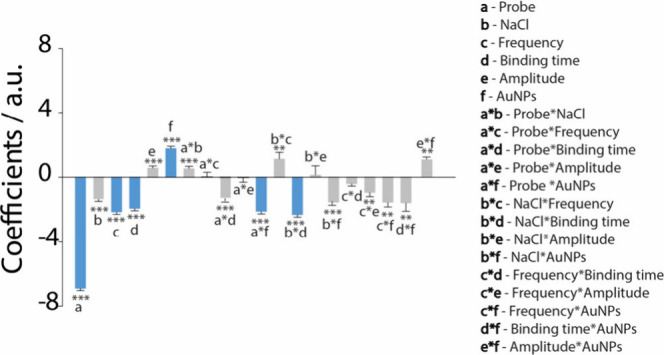
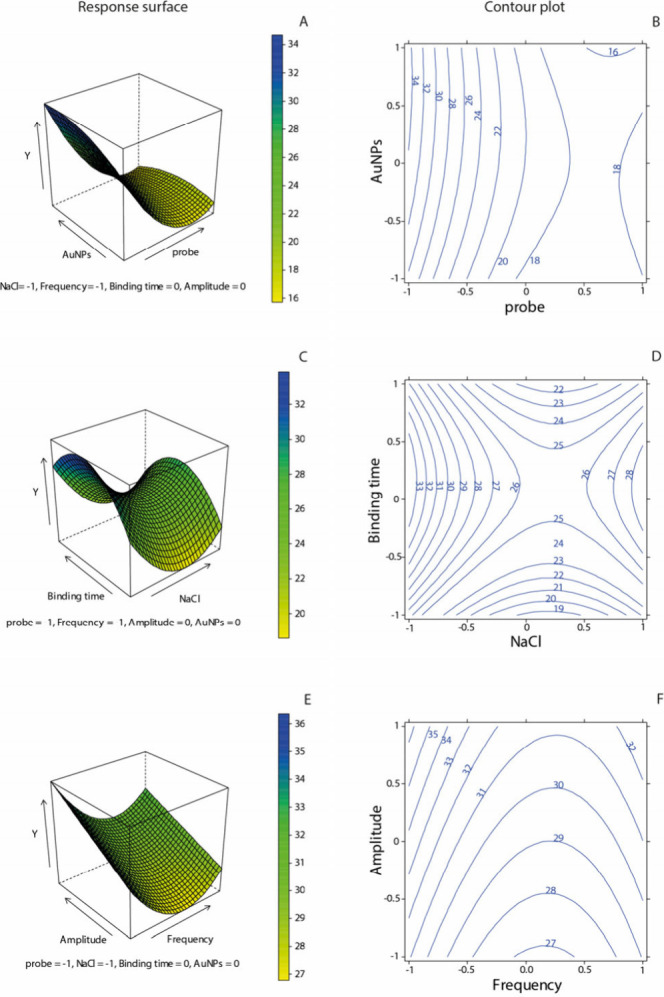
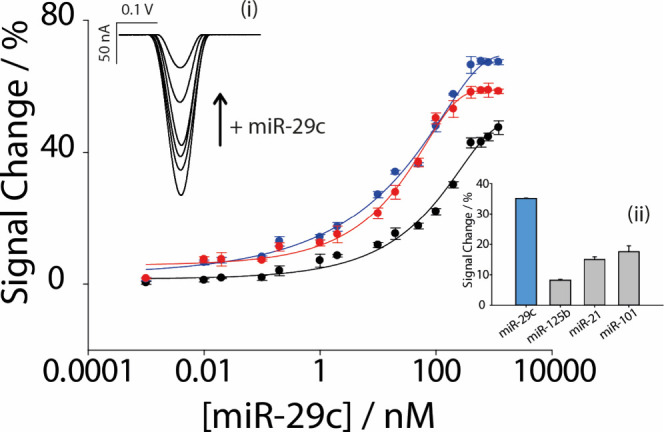
Chemometrics represents a potent tool for optimizing the experimental setup and subsequently boosting the performance of analytical methods. In particular, design of experiments (DoE) allows the experimental conditions to be optimized with high accuracy and a lower number of experiments when compared with the classical univariate approach, also known as one variable at a time (OVAT), which provides only a partial understanding on how factors affect the response. In this work, DoE was exploited, specifically a D-optimal design was used, to improve the analytical performance of a hybridization-based paper-based electrochemical biosensor, taking as target of the study the miRNA-29c (miR-29c) that is related to triple negative breast cancer. The sensing platform is composed of six variables to be optimized, including both those related to the sensor's manufacture (i.e., gold nanoparticles, immobilized DNA probe) and those related to the working conditions (i.e., ionic strength, probe-target hybridization, electrochemical parameters). The adoption of DoE allowed us to optimize the device using only 30 experiments with respect to the 486 that would have been required with the OVAT approach, and as a consequence of the more accurate optimal conditions that have been reached, the detection of miRNA was more sensitive and repeatable when compared with previous data reported using the univariate approach for optimization, leading to a 5-fold limit of detection (LOD) improvement toward miRNA. It confirms that chemometrics might be considered a fundamental tool to be used in the development of various kinds of sensors and biosensors.


Conflict of interest statement

The authors declare no competing financial interest.

Figures

Figure 1
Figure 1
Schematic representation of the comparison between an optimization following DoE and the same platform optimized following OVAT.
Figure 2
Figure 2
Plot of the model coefficients including the linear terms (a–f) and interaction terms. Highlighted in blue are the parameters with the greatest impact for the development of the platform. The level of significance is shown by using the star code (*p < 0.05, **p < 0.01, ***p < 0.001). Negative coefficients indicate inverse relationships, while positive coefficients suggest direct relationships with the response variable.
Figure 3
Figure 3
Response surface 3D and contour plots 2D of the signal change (%) as a function of the following variables: (A) 3D response surface plot of probe concentration and amount of AuNPs. (B) 2D contour plot of probe concentration and amount of AuNPs. (C) 3D response surface plot of binding time and NaCl concentration. (D) 2D contour plot of binding time and NaCl concentration. (E) 3D response surface plot of SWV frequency and amplitude. (F) 2D contour plot of SWV frequency and amplitude. In all of the response surface plots, the lower response is shown in yellow, while the higher response is represented in blue. In the contour plots, the values of −1, 0, and 1 indicate the coded levels of all variables. All plots depict the predicted signal change (%) in the presence of 50 nM target solution across the entire experimental domain.
Figure 4
Figure 4
Signal change (%) of different increasing concentrations of miR-29c in nM range on a logarithmic scale. In black, signal change (%) obtained in PBS with the platform optimized with OVAT; in blue, signal change (%) obtained in PBS with the platform optimized in DOE; and in red, signal change (%) obtained with the platform optimized with DOE in commercial human serum. Insets: (i) SWV image of different increasing concentration of miR-29c; (ii) interference study of miR-29c in the presence of other miRNAs (miR-125b, miR-21, miR-101). All the experiments were carried out in triplicate.

Similar articles

References

    1. Li X.; Ye M.; Zhang W.; Tan D.; Jaffrezic-Renault N.; Yang X.; Guo Z. Liquid Biopsy of Circulating Tumor DNA and Biosensor Applications. Biosens. Bioelectron. 2019, 126, 596–607. 10.1016/j.bios.2018.11.037. - DOI - PubMed
    1. Singh S.; Podder P. S.; Russo M.; Henry C.; Cinti S. Tailored Point-of-Care Biosensors for Liquid Biopsy in the Field of Oncology. Lab Chip 2022, 23 (1), 44–61. 10.1039/D2LC00666A. - DOI - PubMed
    1. Martins I.; Ribeiro I. P.; Jorge J.; Gonçalves A. C.; Sarmento-Ribeiro A. B.; Melo J. B.; Carreira I. M. Liquid Biopsies: Applications for Cancer Diagnosis and Monitoring. Genes (Basel) 2021, 12 (3), 349.10.3390/genes12030349. - DOI - PMC - PubMed
    1. Kilgour E.; Rothwell D. G.; Brady G.; Dive C. Liquid Biopsy-Based Biomarkers of Treatment Response and Resistance. Cancer Cell 2020, 37 (4), 485–495. 10.1016/j.ccell.2020.03.012. - DOI - PubMed
    1. Singh S.; Raucci A.; Cimmino W.; Cinti S. Paper-Based Analytical Devices for Cancer Liquid Biopsy. Anal. Chem. 2024, 96 (9), 3698–3706. 10.1021/acs.analchem.3c04478. - DOI - PubMed

LinkOut - more resources