. 2025 Jun;116(6):1604-1615.
doi: 10.1111/cas.70050. Epub 2025 Apr 11.

Permeable Lung Vasculature Creates Chemoresistant Endothelial Niche by Producing SERPINE1 at Breast Cancer Metastatic Sites

Affiliations

Permeable Lung Vasculature Creates Chemoresistant Endothelial Niche by Producing SERPINE1 at Breast Cancer Metastatic Sites

Tsunaki Hongu et al. Cancer Sci. 2025 Jun.

Abstract

Chemotherapy resistance remains a major obstacle for eradicating metastatic cancer cells in distant organs. We identified that endothelial cells (ECs) in the lungs, where breast cancer cells often metastasize, form a chemoresistant perivascular niche for disseminated breast cancer cells. By investigating the lung EC secretome activated by metastasis, we found that serine protease inhibitor family E member 1 (SERPINE1), encoded by Serpine1, is upregulated in metastasis-associated lung ECs. This upregulation shields cancer cells from paclitaxel-induced apoptosis and promotes cancer stem cell properties. Serpine1 expression appears to be driven by YAP-TEAD activation in lung ECs that lose cell-cell contact, a phenomenon associated with increased vascular permeability in lungs affected by metastasis. Crucially, pharmacological inhibition of SERPINE1 enhances the chemotherapy sensitivity of metastatic breast cancer cells in the lung. Overall, our findings underscore the pivotal role of the vascular niche, which produces SERPINE1, in conferring chemoresistance to breast cancer cells during metastatic progression in the lungs.

Keywords: breast cancer; chemotherapy resistance; metastasis; perivascular niche; permeability.


Conflict of interest statement

Prof. Noriko Gotoh is an Editorial board member of Cancer Science. Other authors do not have conflicts of interest to declare.

Figures

FIGURE 1
FIGURE 1
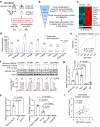
Perivascular metastatic niche contributes to the chemoresistance of metastatic breast cancer cells in the lung. (a) Experimental outline of paclitaxel treatment on mice with metastasis in the lung. MDA231‐LM2 cells were injected intravenously (I.V.) followed by treatment with paclitaxel (20 mg/kg) or vehicle. (b) Immunofluorescence analysis showed a negative correlation of the amounts of lung endothelial cells (ECs, CD31) and cleaved caspase 3 (Cl. Cas3)‐positive cells in lung metastatic tissues 3 days after paclitaxel treatment. Left, representative images; cell nuclei were stained with DAPI. Dashed lines indicate the margins of metastatic foci. Arrowheads show cleaved caspase 3‐positive apoptotic cells. Scale bar, 50 μm. Right, Correlation analysis of CD31‐positive vascular area and cleaved caspase 3‐positive apoptotic cells in metastasis nodules. Linear regression with Pearson correlation r and two‐tailed p values are shown. n = 111 nodules from 3 mice were analyzed. (c) GSEA using lung metastatic breast cancer gene set (GSE14018). There was a positive correlation of the metastasis‐associated lung EC signature and chemotherapy resistance signatures. False discovery rate (FDR) was determined from p values calculated by random permutation test. NES, normalized enrichment score. (d) Paclitaxel (PTX) induced apoptosis was decreased in MDA231‐LM2 cell culture in the conditioned medium (CM) derived from lung ECs. Left, schematic diagram of the experiment. Right top, western blots using indicated antibodies; cleaved (Cl.) caspase 3, an indicator of apoptosis. Right bottom, the ratios of intensities of the bands of Cl. caspase 3 to caspase 3. Means with SEM from 3 independent experiments are shown. The p value was determined by one‐way ANOVA with Tukey's multiple comparison test from 3 independent experiments.
FIGURE 2
FIGURE 2
Metastasis‐associated lung ECs express Serpine1, which correlates with chemoresistance in breast cancer patients. (a) Schematic diagram of the experiments in which gene expression of metastasis‐associated lung ECs was analyzed compared with that of control lung ECs. The data set was deposited as GSE156349. (b) Schematic diagram to narrow down the candidate EC‐derived mediators of the perivascular niche that involve chemotherapy resistance. (c) Heatmap of expression levels of the 9 candidate genes that are highly expressed in metastasis‐associated lung ECs, compared with those in control lung tissue. n = 3 mice per group. (d) Expression analysis of candidate 9 genes in chemotherapy responders and non‐responders among breast cancer patients. Statistics were performed with two‐tailed Mann–Whitney test. n = 100 for responders and n = 123 for non‐responders analyzed for LALBA, INHBB, OPG, FJX1, VASH1, and SERPINE1. n = 17 for responders and n = 100 for non‐responders analyzed for VWA1, SCGB3A1, and LAMA1. ns, not significant. Primer pairs used for qPCR are indicated in Table S2. (e) Receiver Operating Characteristic (ROC) curve of SERPINE1 expression classifying chemotherapy responders and non‐responders. p value was calculated with the ROC test. AUC, area under the curve. (f) Western blot for detecting paclitaxel (PTX)‐induced apoptosis in MDA231‐LM2 cells stimulated with HEK293T‐CM derived from cells expressing the EC‐derived mediators. Data are shown as means with SEM from 3 independent experiments. Statistics was performed with one‐way ANOVA with Dunnett's test. ns, not significant. (g) Relative expression levels of Serpine1 in total lung cells, isolated ECs, fibroblasts (Fibro), bone marrow–derived cells (BMDCs), and epithelial cells (Epi) from lung tissues with metastasis. Data are shown as means with SEM from n = 3 or 4 mice per group. p values were determined by one‐way ANOVA with Tukey's multiple comparison test. (h) Relative expression levels of Serpine1/SERPINE1 in lung ECs (mouse lung ECs and human pulmonary endothelial cells [HPMECs]) and breast cancer cells (4T1 and EO771 are mouse breast cancer cell lines, and MDA231‐LM2 and SUM159 are human breast cancer cell lines). Data are shown as means with SEM from 3 independent experiments. p values were calculated by one‐way ANOVA with Tukey's multiple comparison test. (i) Correlation analysis of SERPINE1 and PECAM1 expression in the data set of 65 distant metastasis tissues of breast cancer patients (GSE14020). Pearson correlation r and two‐tailed p values are shown.
FIGURE 3
FIGURE 3
SERPINE1 promotes chemoresistance and stemness of breast cancer cells. (a, b) Sphere formation of BT20 breast cancer cells in the presence or absence of recombinant SERPINE1 (rSERPINE1) (50 or 200 ng/mL). (a) Representative images of spheres. Scale bar, 500 μm. (b) Quantification of the number of spheres per well. Each dot indicates all technical replicates from 3 biologically independent experiments. p value was calculated by two‐tailed t‐test. n = 3. (c) Heatmap of differentially expressed genes in BT20 cells treated with vehicle or rSERPINE1. Genes with log2FC > 0.3 or < −0.3, and p < 0.05 were included in the heatmap. (d) GSEA showing upregulation of gene set LIM_mammary Stem Cell Up in rSERPINE1‐treated cells. (e) Pathways in C2 cgp collection enriched in rSERPINE1‐treated cells by GSEA. (f) GSEA using the data set of breast cancer lung metastasis tissues (GSE14018) that are stratified according to SERPINE1‐high and ‐low expression. FDR was determined from p values calculated by the random permutation test. NES, normalized enrichment score.
FIGURE 4
FIGURE 4
Weakened cell–cell contact during metastasis elevates Serpine1 expression in lung ECs. (a) Expression of Serpine1 in lung ECs isolated from control mice and mice bearing metastasis. n = 4 mice per group. (b) SERPINE1 mRNA levels in lung ECs cultured with CM from MDA231‐LM2 breast cancer cells. n = 5 independent experiments. Means with SEM are shown in (a) and (b). p values were calculated by two‐tailed t test. (c) Down‐regulated gene signatures in metastasis‐associated lung ECs by GSEA using C2 cp REACTOME collection. (d) GSEA showing decreased cell–cell contact relating signatures in metastasis‐associated lung ECs. FDR was determined from p values calculated by random permutation test. NES, normalized enrichment score. (e) Experimental outline for detecting the lung vascular permeability in vivo. (f) Images of lungs after Evans blue injection followed by perfusion of lung circulation. n = 3 or 4 mice per group. (g) Expression of Serpine1 in lung ECs cultured at different confluency. Data are shown as means with SEM calculated from 3 independent experiments. Scale bar: 250 μm.
FIGURE 5
FIGURE 5
SERPINE1 is regulated by YAP‐TEAD that is activated in metastasis‐associated lung ECs. (a) Immunofluorescence staining of YAP in lung EC line ST1.6R cultured at different confluencies. Left, images of YAP staining in confluent and sparse conditions. Right, Measurement of fluorescence intensities of YAP observed in nuclei. Data are shown as means with SEM from 3 independent experiments. Scale bar: 50 μm. (b) GSEA showing YAP_Conserved_Signature in metastasis‐associated lung ECs. FDR was determined from p values calculated by random permutation test. NES, normalized enrichment score. (c, d) Expression of SERPINE1 in lung ECs transduced by shRNAs against YAP and TAZ (#1; YAP shRNA#1 plus TAZ shRNA#1, #2; YAP shRNA#2 plus TAZ shRNA#2) (Table S3) (c) or TEAD1/2/3/4 (d) cultured at different confluencies. shRNA for TEAD1/3/4 was designed in a region identical in TEAD1, 3, and 4. TEAD2 was additionally targeted using a specific shRNA sequence because of the lack of that common sequence found in other TEADs (Table S3). p values were determined by one‐way ANOVA with Tukey's multiple comparison test. (e) Effect of an inhibitors for YAP‐TEAD interaction on SERPINE1 expression in lung ECs. Expression levels of SERPINE1 was measured after 24 h treatment of cells with verteporfin at the indicated concentration. n = 3 independent experiments. p values were calculated by one‐way ANOVA with Tukey's multiple comparison test. Data in (c–e) are shown as means with SEM. (f) Diagram of human SERPINE1 promoter showing positions of primer pair, flanking TEAD binding motif, and the region amplified by qPCR following ChIP is illustrated as “SERPINE1_chip.” TSS, transcriptional start site. (g) ChIP qPCR analysis of SERPINE1 gene fragments immunoprecipitated by anti‐YAP or anti‐pan‐TEAD antibodies. IgG was used as a control. Data are shown as means with SEM from 5 independent experiments. p values were determined by one‐way ANOVA with Dunnett's multiple comparison test. (h) Model depicting the mechanism of acquired chemoresistance and stemness of breast cancer cells at the lung metastatic sites. Vascular permeability is increased by lung metastasis, which correlates with YAP activation in ECs. Activated ECs provide SERPINE1 to neighboring cancer cells to promote chemoresistance and stemness.
FIGURE 6
FIGURE 6
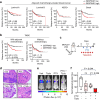
Pharmacological inhibition of SERPINE1 attenuates chemotherapy resistance of breast cancer lung metastasis. (a) Kaplan–Meier analysis of relapse‐free survival (RFS) of breast cancer patients treated with adjuvant chemotherapy by using the K‐M plotter data set. n = 206 patients for luminal A, n = 223 for luminal B, n = 65 for HER2+, and n = 157 for the basal subtype. (b) RFS of TNBC breast cancer patients treated or not treated with chemotherapy by using the K‐M plotter data set. n = 195 for patients with adjuvant chemotherapy, and n = 204 for patients without chemotherapy. Patients were stratified based on median expression levels for all analyses. p value was determined by the log‐rank test. HR, hazard ratio. (c) Experimental outline where mice were intravenously injected with MDA231‐LM2 cells and treated with PTX and the SERPINE1 inhibitor, tiplaxtinin, as a single or a combination treatment. (d) Representative images of hematoxylin/eosin‐stained metastatic lungs. Scale bar, 500 μm. (e) Representative bioluminescence images of lung metastasis. (f) Quantification of lung metastasis based on bioluminescence signal. n = 4 mice for vehicle, n = 5 mice for tiplaxtinin or PTX single treatment, and combination treatment. p values were determined by two‐tailed Welch's test.

References

    1. Lambert A. W., Pattabiraman D. R., and Weinberg R. A., “Emerging Biological Principles of Metastasis,” Cell 168 (2017): 670–691. - PMC - PubMed
    1. O'Reilly D., Sendi M. A., and Kelly C. M., “Overview of Recent Advances in Metastatic Triple Negative Breast Cancer,” World Journal of Clinical Oncology 12 (2021): 164–182. - PMC - PubMed
    1. Bianchini G., De Angelis C., Licata L., and Gianni L., “Treatment Landscape of Triple‐Negative Breast Cancer—Expanded Options, Evolving Needs,” Nature Reviews Clinical Oncology 19 (2022): 91–113. - PubMed
    1. Lainetti P. F., Leis‐Filho A. F., Laufer‐Amorim R., Battazza A., and Fonseca‐Alves C. E., “Mechanisms of Resistance to Chemotherapy in Breast Cancer and Possible Targets in Drug Delivery Systems,” Pharmaceutics 12, no. 12 (2020): 1193, 10.3390/pharmaceutics12121193. - DOI - PMC - PubMed
    1. de Visser K. E. and Joyce J. A., “The Evolving Tumor Microenvironment: From Cancer Initiation to Metastatic Outgrowth,” Cancer Cell 41 (2023): 374–403. - PubMed

MeSH terms

LinkOut - more resources