

Role Analysis of the scarb1 Gene in the Pigmentation of Neocaridina denticulata sinensis
- PMID: 40218295
- PMCID: PMC11987898
- DOI: 10.3390/ani15070901
Role Analysis of the scarb1 Gene in the Pigmentation of Neocaridina denticulata sinensis
Abstract
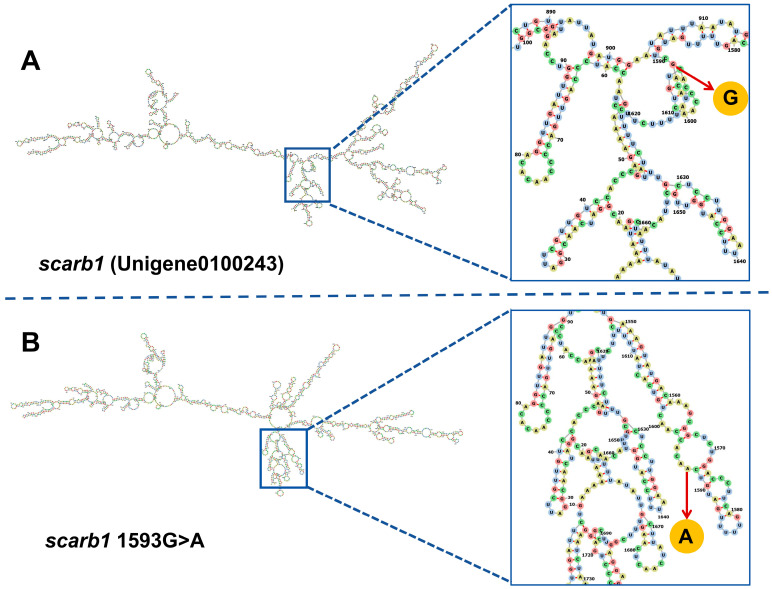
Body color is a key economic trait for Neocaridina denticulata sinensis, an important ornamental shrimp. Scarb1 may be an important mediator of astaxanthin uptake, changing the shrimp's body color. To discover the relationship between scarb1 and the pigmentation of cherry shrimp, the expression profiles, RNAi, and SNP genotyping of scarb1 were studied. There were significant differences in four color populations and five development stages (p < 0.05). The highest expression level of scarb1 appeared in the red population and the pre-nauplius stage. Exposure to scarb1 dsRNA increased the number and development of chromatophores at the metanauplius stage, but almost no phenotypic changes were observed at the pre-zoea stage. There was a synonymous SNP (G1593A) with a significantly different genotype frequency between the red and yellow populations (p < 0.05). The above results suggested that scarb1 is involved in pigmentation by affecting the development of chromatophores.
Keywords: RNAi; SNP genotyping; carotenoid; scavenger receptor class B type I.
Conflict of interest statement
The authors declare no conflicts of interest.
Figures


Similar articles
-
Functional analysis of ABCG2 gene in pigment transport of Neocaridina denticulata sinensis.Gene. 2022 Nov 30;844:146810. doi: 10.1016/j.gene.2022.146810. Epub 2022 Aug 17. Gene. 2022. PMID: 35985411
-
Identification of Functional SSR Markers in Freshwater Ornamental Shrimps Neocaridina denticulata Using Transcriptome Sequencing.Mar Biotechnol (NY). 2020 Dec;22(6):772-785. doi: 10.1007/s10126-020-09979-y. Epub 2020 Jun 11. Mar Biotechnol (NY). 2020. PMID: 32529453
-
Comparative transcriptomic analysis primarily explores the molecular mechanism of compound eye formation in Neocaridina denticulata sinensis.BMC Genomics. 2024 Jun 6;25(1):570. doi: 10.1186/s12864-024-10453-5. BMC Genomics. 2024. PMID: 38844864 Free PMC article.
-
Characterisation of a novel paralog of scavenger receptor class B member I (SCARB1) in Atlantic salmon (Salmo salar).BMC Genet. 2011 May 30;12:52. doi: 10.1186/1471-2156-12-52. BMC Genet. 2011. PMID: 21619714 Free PMC article.
-
Genome-wide identification of crustacyanin and function analysis of one isoform high-expression in carapace from Neocaridina denticulata sinensis.Int J Biol Macromol. 2024 Oct;278(Pt 4):135070. doi: 10.1016/j.ijbiomac.2024.135070. Epub 2024 Aug 24. Int J Biol Macromol. 2024. PMID: 39187096
References
-
- Flores E.E., Chien Y.-H. Chromatosomes in Three Phenotypes of Neocaridina denticulata Kemp, 1918: Morphological and Chromatic Differences Measured Non-Invasively. J. Crustac. Biol. 2011;31:590–597. doi: 10.1651/11-3457.1. - DOI
-
- Huang C.-W., Chu P.-Y., Wu Y.-F., Chan W.-R., Wang Y.-H. Identification of functional SSR markers in freshwater ornamental shrimps Neocaridina denticulata using transcriptome sequencing. Mar. Biotechnol. 2020;22:772–785. - PubMed
-
- Fujii R. The regulation of motile activity in fish chromatophores. Pigment Cell Res. 2000;13:300–319. - PubMed
-
- Wade N.M., Gabaudan J., Glencross B.D. A review of carotenoid utilisation and function in crustacean aquaculture. Rev. Aquac. 2017;9:141–156.
Grants and funding
LinkOut - more resources
Full Text Sources
