

Spatiotemporal Dynamics of Fish Density in a Deep-Water Reservoir: Hydroacoustic Assessment of Aggregation Patterns and Key Drivers
- PMID: 40218461
- PMCID: PMC11988125
- DOI: 10.3390/ani15071068
Spatiotemporal Dynamics of Fish Density in a Deep-Water Reservoir: Hydroacoustic Assessment of Aggregation Patterns and Key Drivers
Abstract
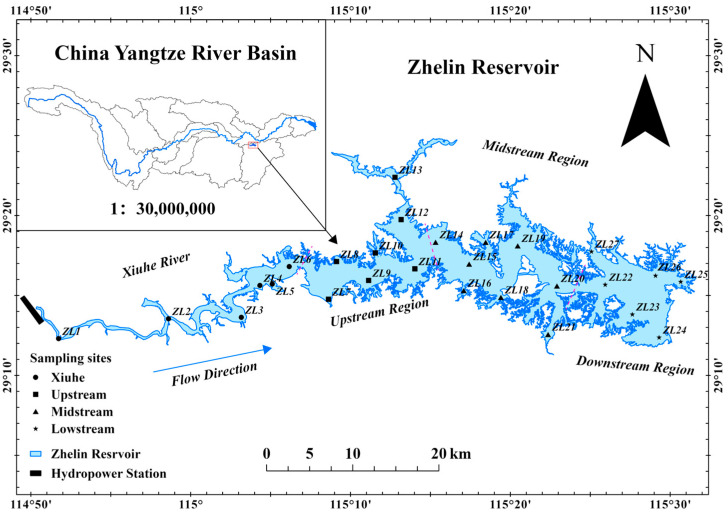
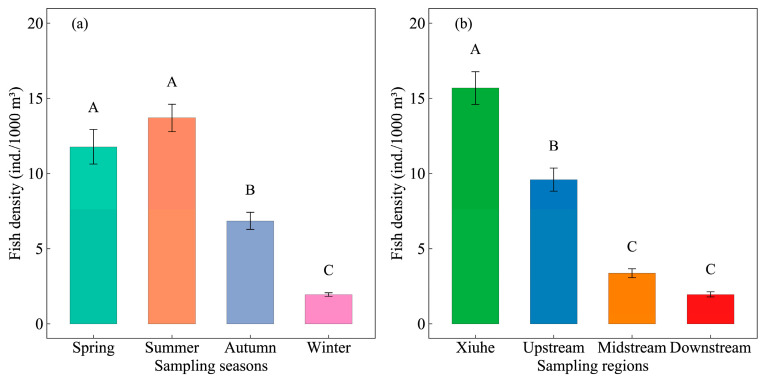
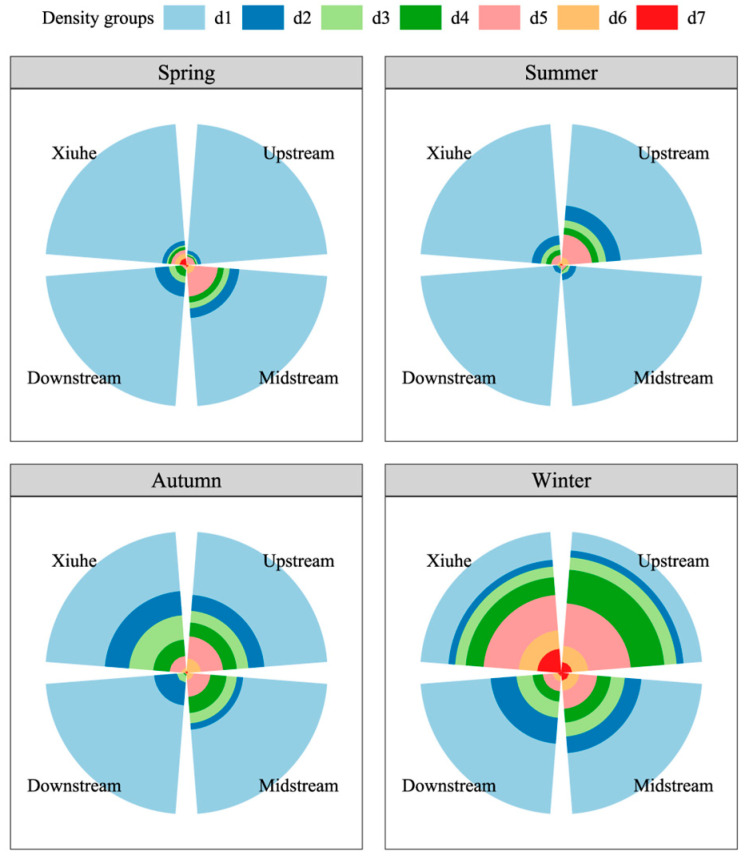
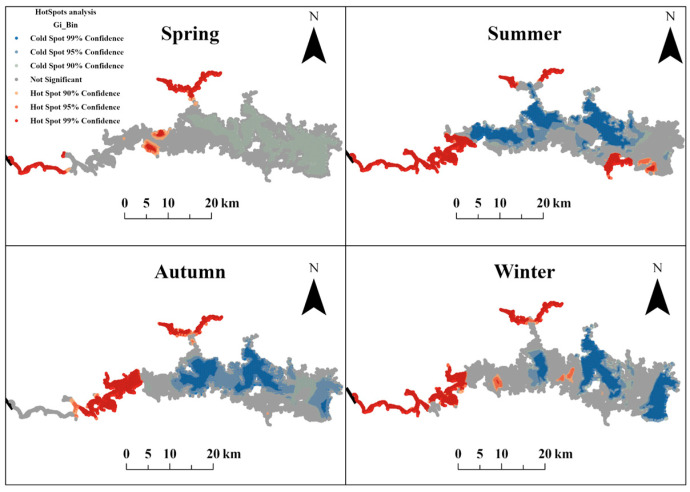
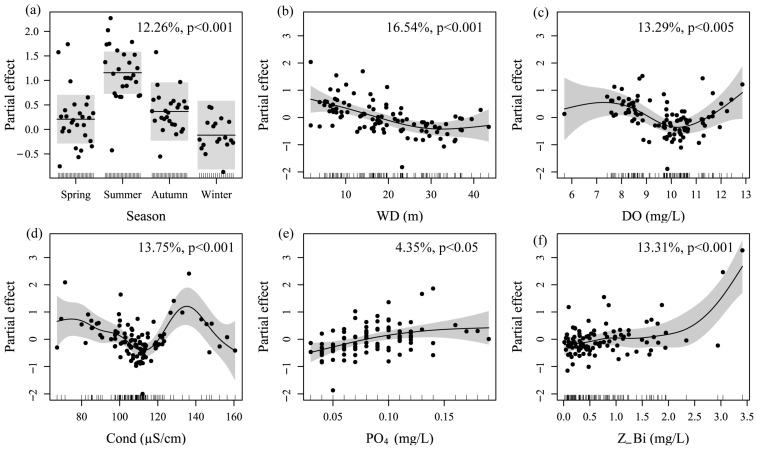
Understanding spatiotemporal patterns of fish density and their environmental drivers is critical for managing river-lake ecosystems, yet dynamic interactions in heterogeneous habitats remain poorly quantified. This study combined hydroacoustic surveys, spatial autocorrelation analysis (Moran's I), and generalized additive models (GAMs) to investigate seasonal and spatial fish distribution, aggregation characteristics, and regulatory mechanisms in China's Zhelin Reservoir. The results reveal pronounced seasonal fluctuations, with summer fish density peaking at 13.70 ± 0.91 ind./1000 m3 and declining to 1.95 ± 0.13 ind./1000 m3 in winter. Spatial heterogeneity was evident, with the Xiuhe region sustaining the highest density (15.69 ± 1.09 ind./1000 m3) and persistent hotspots in upstream bays. Transient high-density clusters (90-99% confidence) near the Zhelin Dam during summer suggested thermal or hydrodynamic disturbances. GAM analysis (R2adj = 0.712, 78.5% deviance explained) identified seasonal transitions (12.26% variance), water depth (16.54%), conductivity (13.75%), and dissolved oxygen (13.29%) as dominant drivers, with nonlinear responses to depth and bimodal patterns for conductivity/oxygen. These findings demonstrate that hydrological seasonality and habitat heterogeneity jointly govern fish aggregation, underscoring the ecological priority of Xiuhe and upstream bays as core habitats. This study provides a mechanistic framework for guiding reservoir management, including targeted conservation, dam operation adjustments to mitigate hydrodynamic impacts, and integrated strategies for balancing hydrological and ecological needs in similar ecosystems.
Keywords: Zhelin Reservoir; acoustics monitoring; environmental gradients; fish distribution; generalized additive models; schooling behavior.
Conflict of interest statement
The authors declare that they have no known competing financial interests or personal relationships that could have appeared to influence the work reported in this paper.
Figures
Similar articles
-
[Hydroacoustic assessment of fish resources in reservoirs with different fishery management].Ying Yong Sheng Tai Xue Bao. 2013 Jan;24(1):235-42. Ying Yong Sheng Tai Xue Bao. 2013. PMID: 23718015 Chinese.
-
Elevational gradients in fish diversity in the Himalaya: water discharge is the key driver of distribution patterns.PLoS One. 2012;7(9):e46237. doi: 10.1371/journal.pone.0046237. Epub 2012 Sep 27. PLoS One. 2012. PMID: 23029444 Free PMC article.
-
Temperature, emergence phenology and consumption drive seasonal shifts in fish growth and production across riverscapes.J Anim Ecol. 2021 Jul;90(7):1727-1741. doi: 10.1111/1365-2656.13491. Epub 2021 Apr 21. J Anim Ecol. 2021. PMID: 33792923
-
Effects of the seasonal flooding on riparian soil seed bank in the Three Gorges Reservoir Region: a case study in Shanmu River.Springerplus. 2016 Apr 21;5:492. doi: 10.1186/s40064-016-2121-9. eCollection 2016. Springerplus. 2016. PMID: 27186456 Free PMC article.
-
Mitigation of ecological impacts on fish of large reservoir sediment management through controlled flushing - The case of the Verbois dam (Rhône River, Switzerland).Sci Total Environ. 2021 Feb 20;756:144053. doi: 10.1016/j.scitotenv.2020.144053. Epub 2020 Nov 24. Sci Total Environ. 2021. PMID: 33279192
References
-
- Kasumyan A.O., Pavlov D.S. Mechanisms of Schooling Behavior of Fish. J. Ichthyol. 2023;63:1279–1296.
-
- Arevalo E., Cabral H.N., Villeneuve B., Possémé C., Lepage M. Fish larvae dynamics in temperate estuaries: A review on processes, patterns and factors that determine recruitment. Fish Fish. 2023;24:466–487. doi: 10.1111/faf.12740. - DOI
-
- Kasumyan A.O., Pavlov D.S. Influence of Environmental Factors and the Condition of Fish on Schooling Behavior. J. Ichthyol. 2023;63:1362–1373. doi: 10.1134/S0032945223070123. - DOI
Grants and funding
- YFI20240102,YFI202418/Central Public-interest Scientific Institution Basal Research Fund
- CARS-46/China Agriculture Research System of MOF and MARA
- 2023TD61/Central Public-interest Scientific Institution Basal Research Fund, CAFS
- 20223BBF61010/Key Research and Development Program of Jiangxi Province
- 2023YFD240090/National Key Research and Development Program of China
LinkOut - more resources
Full Text Sources
