. 2025 Mar 25;25(7):2035.
doi: 10.3390/s25072035.

Respiratory Monitoring with Textile Inductive Electrodes in Driving Applications: Effect of Electrode's Positioning and Form Factor on Signal Quality

Affiliations

Respiratory Monitoring with Textile Inductive Electrodes in Driving Applications: Effect of Electrode's Positioning and Form Factor on Signal Quality

James Elber Duverger et al. Sensors (Basel). .

Abstract

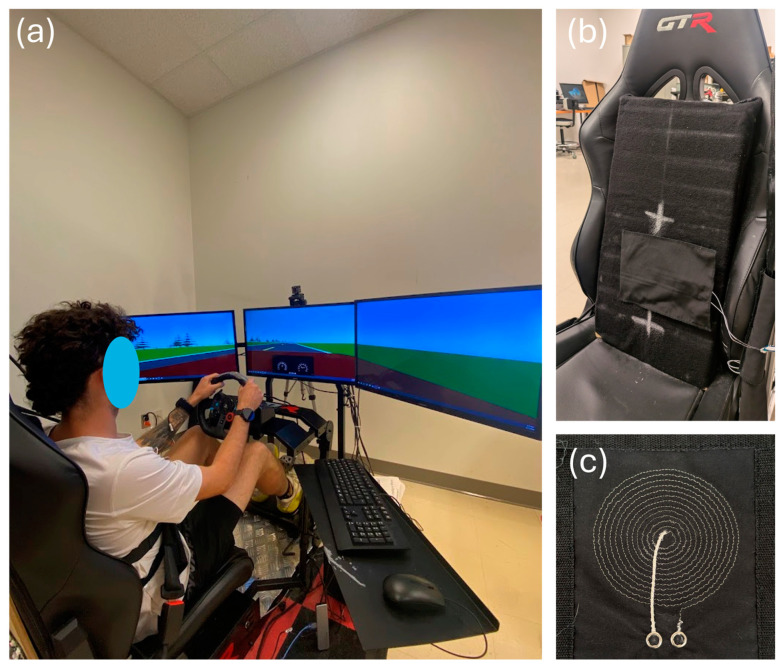
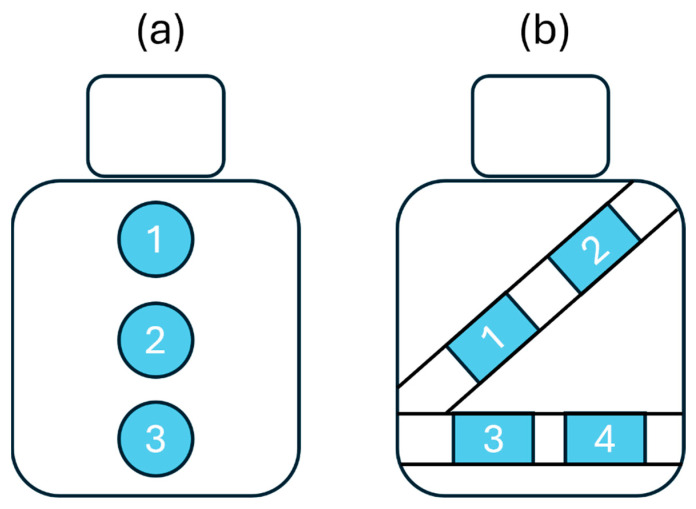
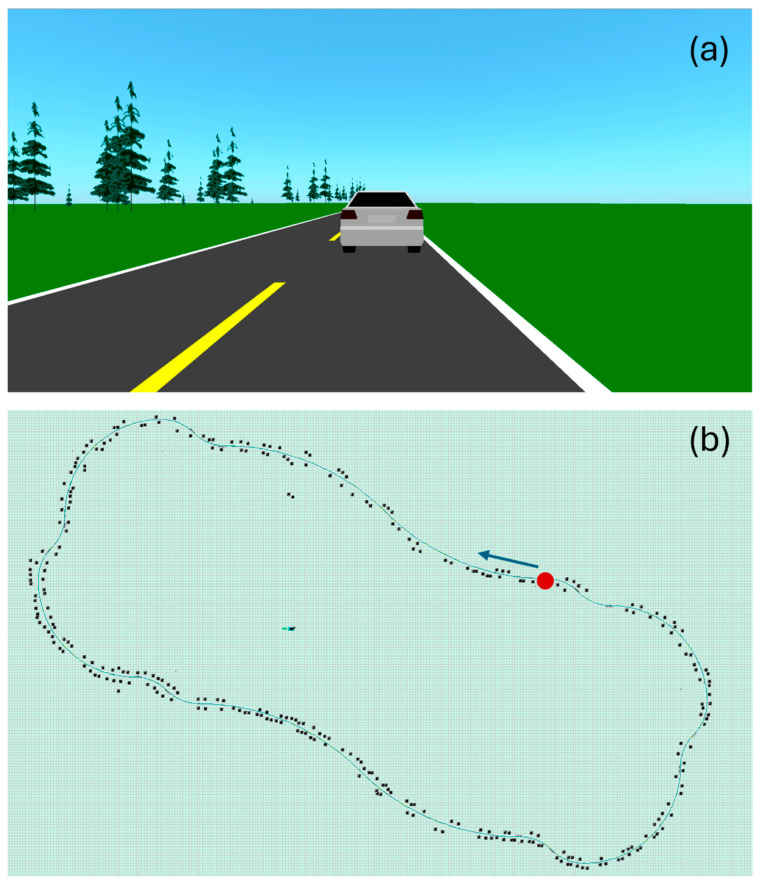
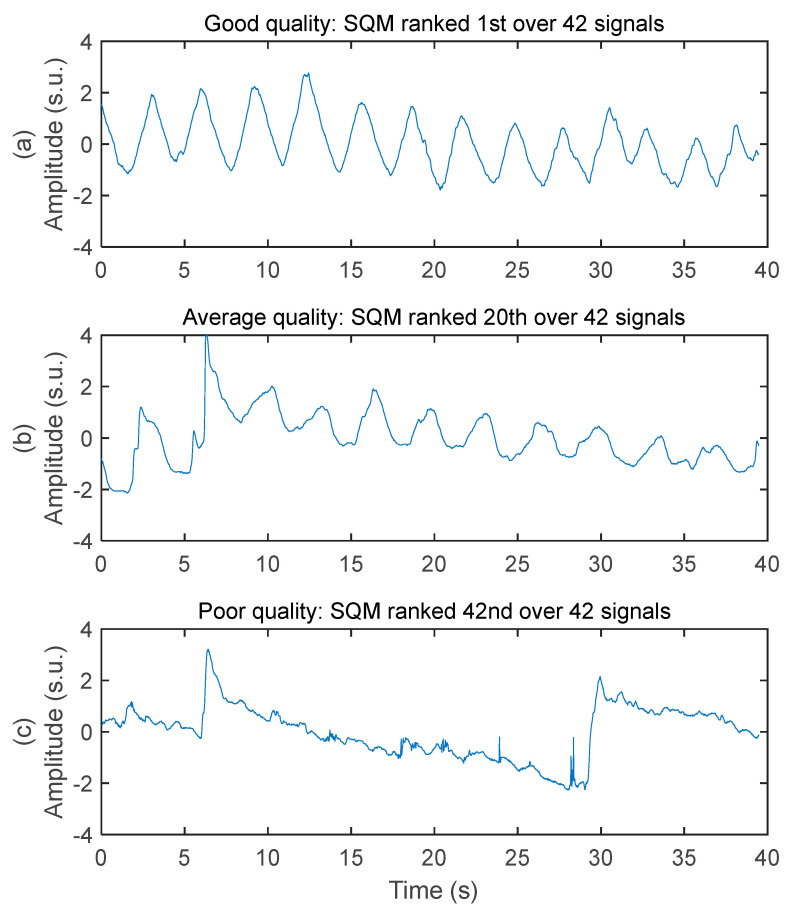
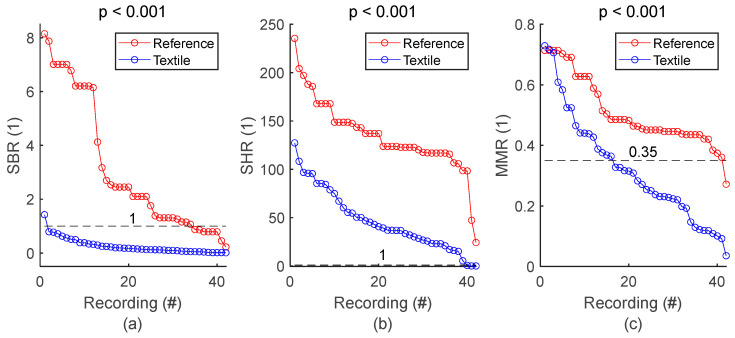
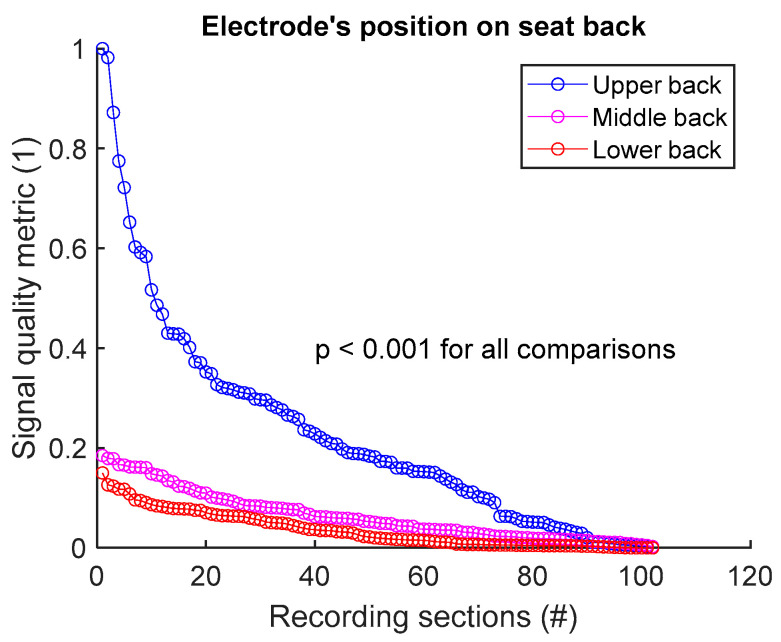
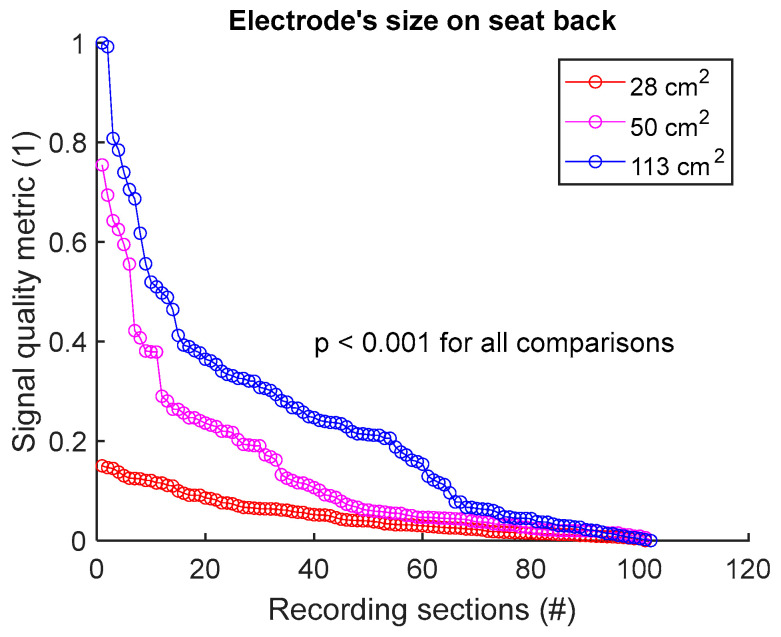
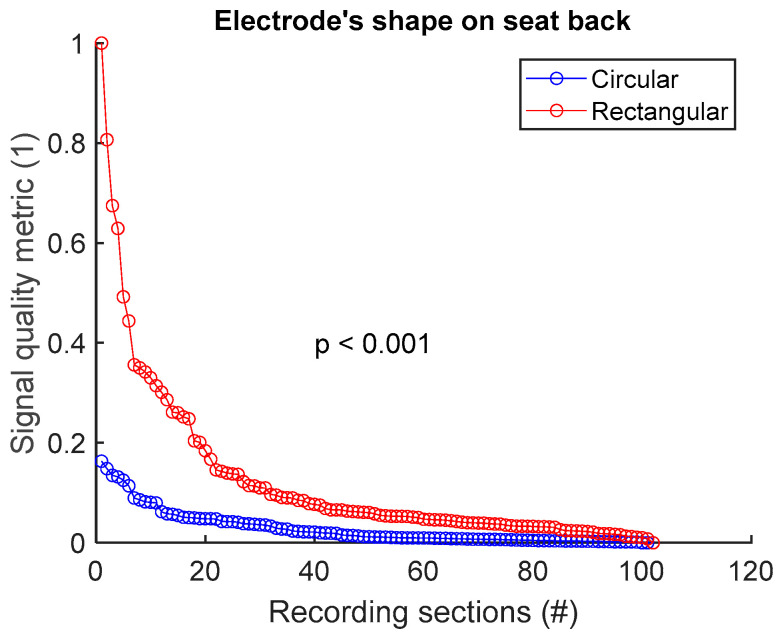
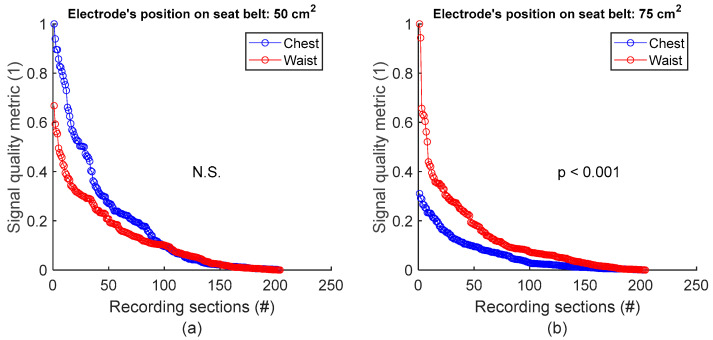
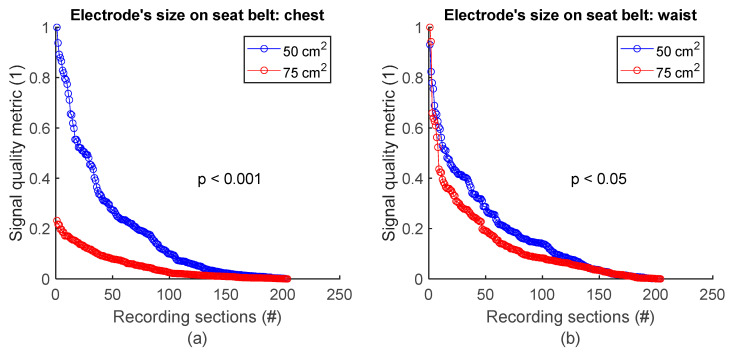
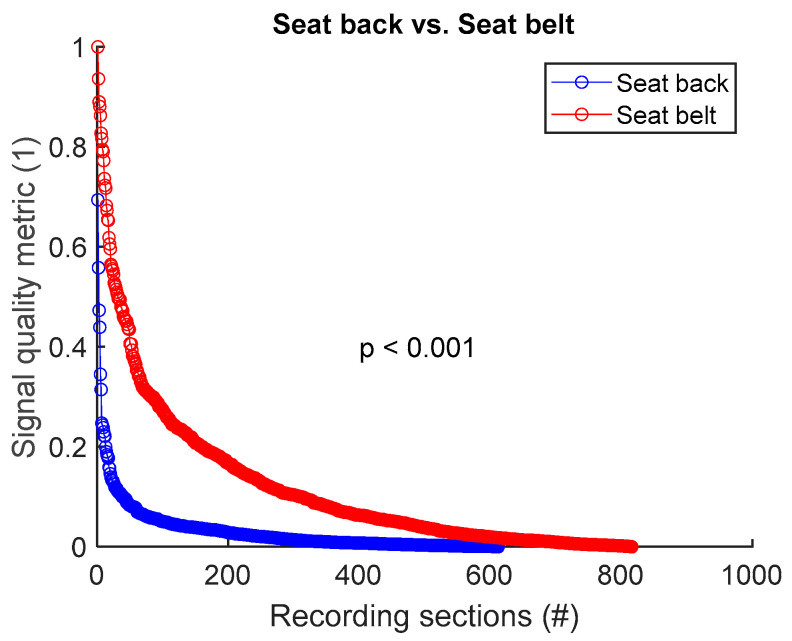
This paper provides insights into where and how to integrate textile inductive electrodes into a car to record optimal-quality respiratory signals. Electrodes of various shapes and sizes were integrated into the seat belt and the seat back of a driving simulator car seat. The electrodes covered various parts of the body: upper back, middle back, lower back, chest, and waist. Three subjects completed driving circuits with their breathing signals being recorded. In general, signal quality while driving versus sitting still was similar, compared to a previous study of ours with no body movements. In terms of positioning, electrodes on seat belt provided better signal quality compared to seat back. Signal quality was directly proportional to electrode's height on the back, with upper back outperforming both middle and lower back. Electrodes on the waist provided either similar or superior signal quality compared to electrodes on the chest. In terms of form factor, rectangular shape outperformed circular shape on seat back. Signal quality is proportional to the size of circular electrodes on seat back, and inversely proportional to size of rectangular electrode on seat belt.

Keywords: automobile; automotive application; breathing sensor; driver health status; driving application; inductive sensing; respiratory monitoring; respiratory signal; signal quality index; textile inductive electrode.


Conflict of interest statement

The authors declare no conflict of interest. The funders had no role in the design of the study; in the collection, analyses, or interpretation of data; in the writing of the manuscript; or in the decision to publish the results.

Figures

Figure 1
Figure 1
The driving simulator. (a) Complete setup. (b) Zoom-in on the car seat. The textile inductive electrode is hidden behind the black substrate fabric between the two white crosses. (c) The circular textile inductive electrode A.73.12.
Figure 2
Figure 2
Diagram showing textile inductive electrodes’ positions. (a) There are three positions on the seat back: upper back (1), middle back (2), and lower back (3) position. (b) There are four positions on the seat belt: chest (1, 2), and waist (3, 4).
Figure 3
Figure 3
Print screens of the driving simulator’s user interface. (a) Scenery. The road is bordered with greenery, including trees. While driving, the subject is following a car. (b) Driving circuit. The green line represents the road. The black dots are trees. The circuit starts at the red dot, in the direction of the blue arrow.
Figure 4
Figure 4
Examples of respiratory signal with various signal quality. Amplitudes are all in standard score unit and displayed within the same axis limits to allow direct comparison. (a) Good signal quality. Recorded on the chest of subject #1 with a 50 cm2 rectangular electrode on seat belt. (b) Average signal quality. Recorded on the chest of subject #3 with a 50 cm2 rectangular electrode on seat belt. (c) Poor signal quality. Recorded on the middle back of subject #3 with a 28 cm2 circular electrode on seat back.
Figure 5
Figure 5
General assessment of signal quality: reference vs. textile. (a) Comparison of SBR values. (b) Comparison of SHR values. (c) Comparison of MMR values. SQIs are sorted in decreasing order and plotted for reference and textile electrodes. There is one dot for each respiratory signal. The value of one dot is the average of 34 SQIs calculated on 34 one-minute sections of signal.
Figure 6
Figure 6
Signal quality vs. electrode’s position on seat back. Normalized SQMs are sorted in decreasing order and plotted. There is one dot for each one-minute section of textile respiratory signal. The value of one dot is the SQM calculated for one section of respiratory signal.
Figure 7
Figure 7
Signal quality vs. electrode’s size on seat back. Normalized SQMs are sorted in decreasing order and plotted. There is one dot for each one-minute section of textile respiratory signal. The value of one dot is the SQM calculated for one section of respiratory signal.
Figure 8
Figure 8
Signal quality vs. electrode’s shape on seat back. Normalized SQMs are sorted in decreasing order and plotted. There is one dot for each one-minute section of textile respiratory signal. The value of one dot is the SQM calculated for one section of respiratory signal.
Figure 9
Figure 9
Signal quality vs. electrode’s position on seat belt. (a) Chest vs. waist with 50 cm2 electrode. (b) Chest vs. waist with 75 cm2 electrode. For each panel, normalized SQMs are sorted in decreasing order and plotted. There is one dot for each one-minute section of textile respiratory signal. The value of one dot is the SQM calculated for one section of respiratory signal.
Figure 10
Figure 10
Signal quality vs. electrode’s size on seat belt. (a) 50 cm2 vs. 75 cm2 on chest. (b) 50 cm2 vs. 75 cm2 on waist. Normalized SQMs are sorted in decreasing order and plotted. There is one dot for each one-minute section of textile respiratory signal. The value of one dot is the SQM calculated for one section of respiratory signal.
Figure 11
Figure 11
Signal quality: seat back vs. seat belt. Normalized SQMs are sorted in decreasing order and plotted. There is one dot for each one-minute section of textile respiratory signal. The value of one dot is the SQM calculated for one section of respiratory signal.

Similar articles

References

    1. Leonhardt S., Leicht L., Teichmann D. Unobtrusive vital sign monitoring in automotive environments—A review. Sensors. 2018;18:3080. doi: 10.3390/s18093080. - DOI - PMC - PubMed
    1. Naziyok T.P., Zeleke A.A., Röhrig R. Contactless patient monitoring for general wards: A systematic technology review. Explor. Complex. Health Interdiscip. Syst. Approach. 2016:707–711. doi: 10.3233/978-1-61499-678-1-707. - DOI - PubMed
    1. Khan M.A., Sayed H.E., Malik S., Zia T., Khan J., Alkaabi N., Ignatious H. Level-5 autonomous driving—Are we there yet? a review of research literature. ACM Comput. Surv. (CSUR) 2022;55:1–38. doi: 10.1145/3485767. - DOI
    1. Zhao J., Zhao W., Deng B., Wang Z., Zhang F., Zheng W., Cao W., Nan J., Lian Y., Burke A.F. Autonomous driving system: A comprehensive survey. Expert Syst. Appl. 2023;242:122836.
    1. Rhiu I., Kwon S., Bahn S., Yun M.H., Yu W. Research Issues in Smart Vehicles and Elderly Drivers: A Literature Review. Int. J. Hum.—Comput. Interact. 2015;31:635–666. doi: 10.1080/10447318.2015.1070540. - DOI

LinkOut - more resources