

Evaluating Sparse Inertial Measurement Unit Configurations for Inferring Treadmill Running Motion
- PMID: 40218622
- PMCID: PMC11991315
- DOI: 10.3390/s25072105
Evaluating Sparse Inertial Measurement Unit Configurations for Inferring Treadmill Running Motion
Abstract
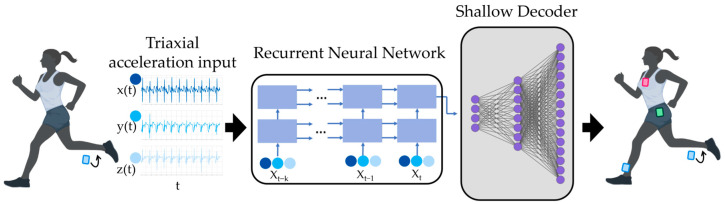
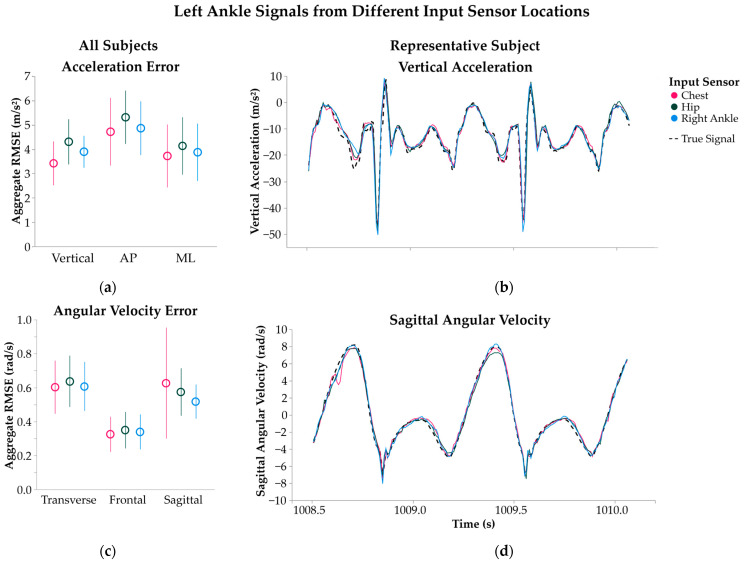
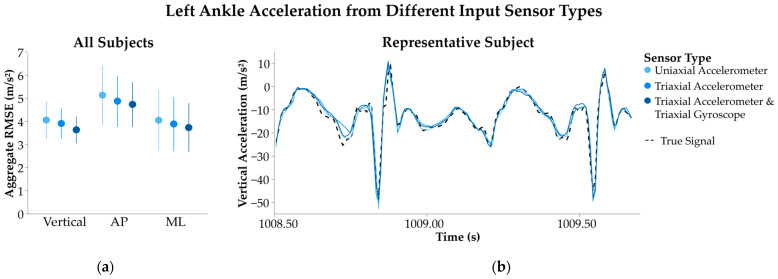
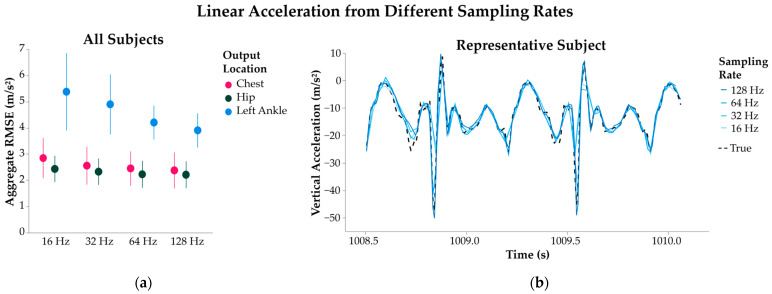
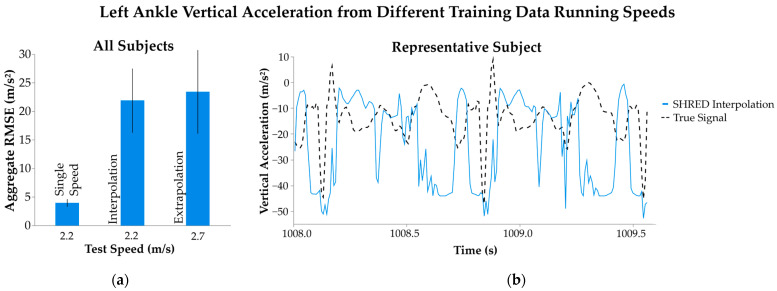
Inertial measurement units (IMUs) are used to analyze running performance. While leveraging one sensor to estimate kinematic and kinetic variables is common, sparsity limits the number of digital biomarkers that can be evaluated. Shallow recurrent decoder networks (SHRED) can reconstruct a dense set of time-series signals from a single input sensor and have been successful in human mobility applications, highlighting the potential for this algorithm to monitor running. We trained and tested subject-specific SHRED models of nine subjects running on a treadmill to map from one input sensor to the remaining three IMUs. We varied the type of input to reflect experimental parameters that are important in running studies-sensor location, sensor type, sampling rate, and running speed-and compared the error of inferred signals from each input type. Sensor location and type did not impact SHRED inference accuracy, while decreasing the sampling rate affected the accuracy of ankle measurements. All ankle acceleration inferences from these models remained below the minimal detectable change threshold of 12.0 m/s2. SHRED models trained and tested at multiple speeds did not accurately infer IMU measurements below this threshold. SHRED may broaden the scope of motion analysis by expanding datasets with fewer sensors.
Keywords: IMU; accelerometer; machine learning; running; sampling rate; sparse sensing.
Conflict of interest statement
The authors declare no conflicts of interest. The funders had no role in the design of the study; in the collection, analyses, or interpretation of data; in the writing of the manuscript; or in the decision to publish the results.
Figures
Similar articles
-
A machine learning approach to real-time calculation of joint angles during walking and running using self-placed inertial measurement units.Gait Posture. 2025 May;118:85-91. doi: 10.1016/j.gaitpost.2025.01.028. Epub 2025 Jan 26. Gait Posture. 2025. PMID: 39914248
-
Lower body kinematics estimation from wearable sensors for walking and running: A deep learning approach.Gait Posture. 2021 Jan;83:185-193. doi: 10.1016/j.gaitpost.2020.10.026. Epub 2020 Oct 27. Gait Posture. 2021. PMID: 33161275
-
Towards Machine Learning-Based Detection of Running-Induced Fatigue in Real-World Scenarios: Evaluation of IMU Sensor Configurations to Reduce Intrusiveness.Sensors (Basel). 2021 May 15;21(10):3451. doi: 10.3390/s21103451. Sensors (Basel). 2021. PMID: 34063478 Free PMC article.
-
Is This the Real Life, or Is This Just Laboratory? A Scoping Review of IMU-Based Running Gait Analysis.Sensors (Basel). 2022 Feb 23;22(5):1722. doi: 10.3390/s22051722. Sensors (Basel). 2022. PMID: 35270869 Free PMC article.
-
Fatigue assessment in distance runners: A scoping review of inertial sensor-based biomechanical outcomes and their relation to fatigue markers and assessment conditions.Gait Posture. 2025 Jan;115:21-33. doi: 10.1016/j.gaitpost.2024.10.012. Epub 2024 Oct 29. Gait Posture. 2025. PMID: 39471649
References
-
- Preatoni E., Bergamini E., Fantozzi S., Giraud L.I., Orejel Bustos A.S., Vannozzi G., Camomilla V. The Use of Wearable Sensors for Preventing, Assessing, and Informing Recovery from Sport-Related Musculoskeletal Injuries: A Systematic Scoping Review. Sensors. 2022;22:3225. doi: 10.3390/s22093225. - DOI - PMC - PubMed
MeSH terms
Grants and funding
LinkOut - more resources
Full Text Sources
