Relationship Between Lower-Extremity Co-Contraction and Jerk During Gait
- PMID: 40218839
- PMCID: PMC11991252
- DOI: 10.3390/s25072327
Relationship Between Lower-Extremity Co-Contraction and Jerk During Gait
Abstract
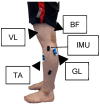
The elderly exhibit increased co-contraction (CC) during gait, reducing movement smoothness. The jerk has been used to quantitatively smoothness. This study aimed to investigate the relationship between lower-leg jerk and lower-extremity CC during gait. Participants were 30 healthy middle-aged and elderly people. Surface electromyography (EMG) was measured from the tibialis anterior (TA), gastrocnemius lateralis (GL), vastus lateralis (VL), and biceps femoris (BF). An inertial measurement unit was attached to the lower-leg. Jerk was calculated from inertial measurement unit (IMU) acceleration data, and CC was quantified as the percent co-contraction index (CCI) for TAGL, VLBF, and VLGL. To examine the correlation between CCI and jerk, the part with the highest correlation between jerk and CC during gait was used as the dependent variable, and a multiple regression analysis was performed to obtain the estimated CC values (p < 0.05). VLGL CCI increased with higher jerk during the second half of the stance phase and also increased as gait speed declined. The CCI of the VLGL in-creased with age. The multiple regression analysis adjusted for age and gait speed revealed a relationship between jerks and CCI. The CCI of the VLGL is most closely related to lower-leg jerks, which affect the gait of the elderly.
Keywords: IMU; co-contraction; elderly; gait.
Conflict of interest statement
The authors declare no conflicts of interest.
Figures


Similar articles
-
Motor Planning for Loading During Gait in Subacute Stroke.Arch Phys Med Rehabil. 2016 Apr;97(4):528-535. doi: 10.1016/j.apmr.2015.11.003. Epub 2015 Nov 26. Arch Phys Med Rehabil. 2016. PMID: 26631957
-
Tai Chi training's effect on lower extremity muscle co-contraction during single- and dual-task gait: Cross-sectional and randomized trial studies.PLoS One. 2021 Jan 22;16(1):e0242963. doi: 10.1371/journal.pone.0242963. eCollection 2021. PLoS One. 2021. PMID: 33481829 Free PMC article. Clinical Trial.
-
Electromyographic patterns of lower limb muscles during apprehensive gait in younger and older female adults.J Electromyogr Kinesiol. 2013 Oct;23(5):1145-9. doi: 10.1016/j.jelekin.2013.06.006. Epub 2013 Jul 20. J Electromyogr Kinesiol. 2013. PMID: 23880233
-
Contributions to the understanding of gait control.Dan Med J. 2014 Apr;61(4):B4823. Dan Med J. 2014. PMID: 24814597 Review.
-
Factors, characteristics and influences of the changes of muscle activation patterns for patients with knee osteoarthritis: a review.J Orthop Surg Res. 2025 Jan 30;20(1):112. doi: 10.1186/s13018-025-05484-x. J Orthop Surg Res. 2025. PMID: 39885604 Free PMC article. Review.
References
MeSH terms
Grants and funding
LinkOut - more resources
Full Text Sources
Miscellaneous

