

Association Between Increased Dietary Sodium Intake and Higher Water Intake from Fluid and Food in Children
- PMID: 40218857
- PMCID: PMC11990302
- DOI: 10.3390/nu17071099
Association Between Increased Dietary Sodium Intake and Higher Water Intake from Fluid and Food in Children
Abstract
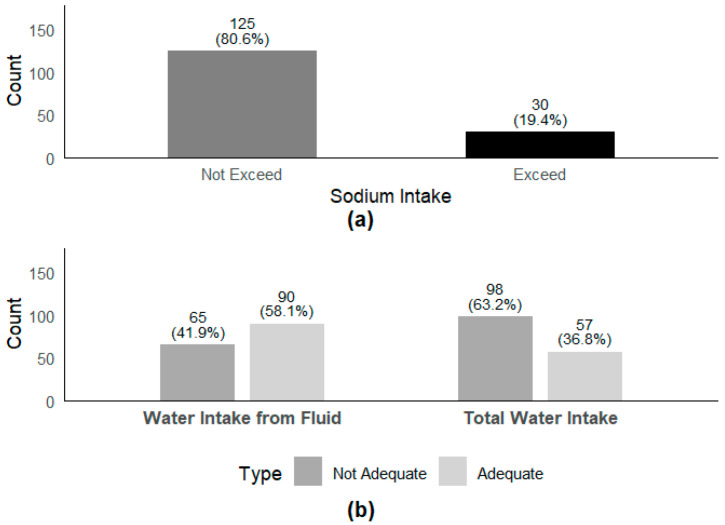
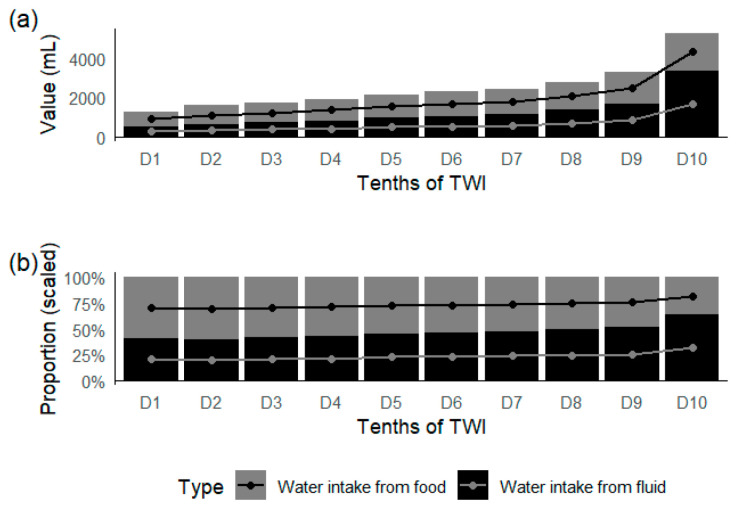
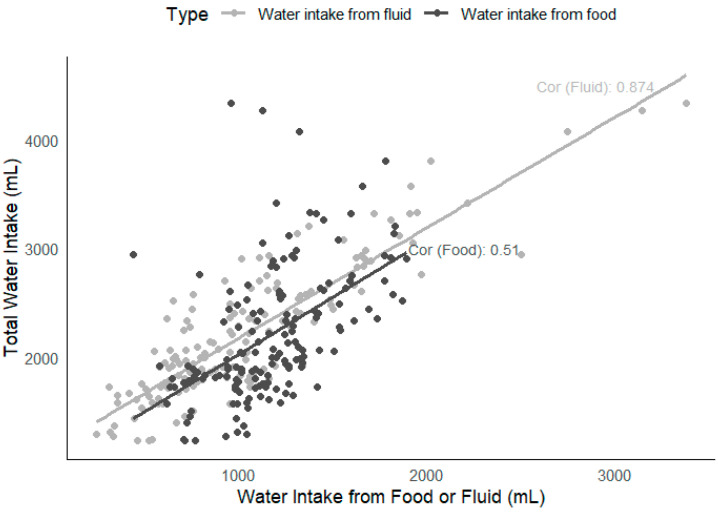
Background and Objectives: Maintaining an appropriate hydration status is crucial for promoting health. Children, who are in the process of growth and development, are at a higher risk of insufficient water intake and dehydration. This study aimed to compare water intake among children with different levels of dietary sodium intake, and explore the relationship between hydration status, and dietary sodium intake and water intake. Methods: In this cross-sectional survey, 155 students in grades 4-6 from a primary school in Binyang County, Nanning, Guangxi, were recruited. Water intake from fluid was assessed using a validated 7-Day 24 h Fluid Intake Survey Questionnaire (days 1-7). Food intake was recorded and weighed using the duplicate diet method on days 5, 6, and 7. The water content in food was determined using the direct drying method, and dietary sodium intake was measured using inductively coupled plasma-optical emission spectrometry (ICP-OES). Urine osmolality was measured at two time points (morning and before afternoon classes) on days 5, 6, and 7 to assess hydration status. Results: A total of 155 participants (87 boys and 68 girls) completed the study, with a completion rate of 100%. The average dietary sodium intake, total water intake (TWI), water intake from fluid, and water intake from food were 1647 mg, 2039 mL, 956 mL, and 1175 mL, respectively. Among the participants, 19.4% exceeded the recommended sodium intake (2000 mg/day), 41.9% did not meet the adequate daily water intake from fluid, and 63.2% did not meet the adequate daily total water intake. When participants were divided into quartiles based on dietary sodium intake, significant differences were observed in water intake from fluid (p = 0.031) and food (p < 0.001). The water intake from fluid among participants in the HS1 (982 mL) and HS2 groups (997 mL) was higher than that among participants in LS2 (759 mL). Water intake from food increased progressively with increasing sodium intake (851 mL, 1075 mL, 1224 mL, and 1550 mL). Urine osmolality was associated with meeting the daily adequate water intake from fluid (p = 0.006), but not with exceeding the sodium intake standard (p = 0.787). There was no interaction between meeting the daily adequate water intake from fluid and exceeding the sodium intake standard (p = 0.413). Conclusions: Insufficient water intake was common among children. Children with a higher dietary sodium intake had a higher water intake from fluid and food. Urine osmolality was closely related to daily water intake from fluid, but not to sodium intake.
Keywords: children; hydration status; sodium intake; water intake from fluid; water intake from food.
Conflict of interest statement
The authors declare no conflicts of interest.
Figures
Similar articles
-
Young Adults with Higher Salt Intake Have Inferior Hydration Status: A Cross-Sectional Study.Nutrients. 2022 Jan 11;14(2):287. doi: 10.3390/nu14020287. Nutrients. 2022. PMID: 35057468 Free PMC article.
-
Behaviors of Water Intake, Hydration Status, and Related Hydration Biomarkers among Physically Active Male Young Adults in Beijing, China: A Cross-Sectional Study.Int J Clin Pract. 2022 Oct 17;2022:9436186. doi: 10.1155/2022/9436186. eCollection 2022. Int J Clin Pract. 2022. PMID: 36320894 Free PMC article.
-
A Study of the Fluid Intake, Hydration Status, and Health Effects among Pregnant Women in Their Second Trimester in China: A Cross-Sectional Study.Nutrients. 2023 Apr 2;15(7):1739. doi: 10.3390/nu15071739. Nutrients. 2023. PMID: 37049579 Free PMC article.
-
Water intake and hydration state in children.Eur J Nutr. 2019 Mar;58(2):475-496. doi: 10.1007/s00394-018-1869-9. Epub 2018 Nov 30. Eur J Nutr. 2019. PMID: 30506317 Review.
-
Dietary treatment of urinary risk factors for renal stone formation. A review of CLU Working Group.Arch Ital Urol Androl. 2015 Jul 7;87(2):105-20. doi: 10.4081/aiua.2015.2.105. Arch Ital Urol Androl. 2015. PMID: 26150027 Review.
References
-
- Chinese Nutrition Society . The Chinese Dietary Guidelines (2022) People’s Medical Publishing House; Beijing, China: 2022.
-
- Ma G.S. Hydration status and health. Chin. J. Prev. Med. 2019;53:337–341. - PubMed
-
- Jiang Z. Clinical Water and Electrolytes Balance. 3rd ed. People’s Medical Publishing House; Beijing, China: 2013.
MeSH terms
Substances
Grants and funding
LinkOut - more resources
Full Text Sources
Medical
Research Materials
Miscellaneous
