. 2025 Mar 26;17(7):1150.
doi: 10.3390/nu17071150.

Can Iron Absorption in Molasses Be Increased with Probiotic Additives? "Molasses with Increased Bioavailability"

Affiliations

Can Iron Absorption in Molasses Be Increased with Probiotic Additives? "Molasses with Increased Bioavailability"

Yasin Yıldız et al. Nutrients. .

Abstract

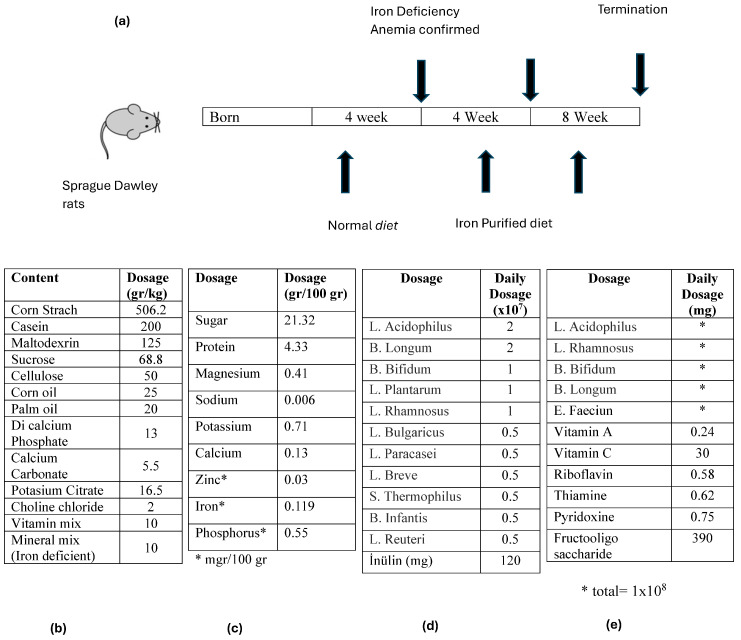
Introduction: There are many studies on the chemical and enzymatic interactions of probiotics, and the effects of Lactobacillus plantarum 299v on iron absorption have been clearly shown. The aim of this study was to investigate the effect of probiotics on the absorption of iron in molasses. Material and method: Wistar rats (n = 46) were taken four weeks after birth and divided into seven groups. Iron deficiency anemia was induced by giving "iron purified pellet" to the groups except the control group for four weeks and then the groups were given nutrients for eight weeks. In addition to iron deficiency anemia tests, immunohistochemical markers such as SCL11a, IRE1, Wnt2, and CD71 were examined. Results: The mean weight of the subjects was 309.5 ± 63.9 (226-424) g and no significant difference was observed in the laboratory values of metabolic data. When the laboratory values of iron deficiency anemia were examined, a statistically significant difference was found between the mean ferritin (p = 0.03) and hepcidin (p = 0.02) values of the groups. Discussion: Iron absorption analysis values were generally higher in the group receiving Fe3+ as expected. However, when the groups receiving molasses and additives were compared, the highest plasma iron level and Hb value were found in the Lactobacillus plantarum 299v group, and the highest ferritin and hepcidin levels were found in the Multiprobiotic group. No difference was observed between the body weights and fasting serum glucose levels of the groups despite daily molasses consumption, indicating the metabolic proactive effects of probiotics. Conclusions: Although no significant difference was detected between the groups receiving probiotics, iron absorption in molasses was increased with probiotic supplementation.

Keywords: iron absorption; molasses; prebiotic; probiotic.


Conflict of interest statement

The authors declare no conflicts of interest.

Figures

Scheme 1
Scheme 1
The timeline of the study and the characteristics of the food supplements used: (a) the experimental animals were given iron purified diet for 4 weeks after birth and then iron purified diet and food supplements for 8 weeks after the occurrence of iron deficiency anemia was confirmed, (b) chemical content of iron purified diet, (c) chemical content of molasses, (d) content of polyprobiotic supplement given to Group 6, and (e) content of the polyprobiotic supplement given to Group 7.
Figure 1
Figure 1
Representative light microscopic pictures of small intestinal sections stained with Goldners Masson Trichrome stain. Villus (V), Lieberkühn crypt (Lc), Lamia propria (Lp), epithelium (E). (A) (×200), (B) (×400) Group 1: In the intestinal tissue sections of the control group, a mucosa (arrow) structure consisting of single-layer prismatic epithelium with typical villus structures is observed (MHDS: 0 (0–0)). (C) (×200), (D) (×400) Group 2: Sloughing of single-layer prismatic cells with microvilli (arrowhead) and villar fusions (spiral arrow) are observed in the villi. In addition, diffuse inflammations (curved arrows) are observed in the lamina propria (MHDS: 3.5 (3–4)). (E) (×20), (F) (×40) Group 3: Epithelial shedding (arrow), villus loss (spiral arrow) and reduction in inflammation are observed. (MHDS: 2 (2–2)). (G) (×200), (H) (×400) Group 4: Sloughing of enterocytes (arrow) and decrease in interstitial inflammation (spiral arrow) are observed (MHDS: 2(1–2)). (I) (×200), (J) (×400) Group 5: Single-layer prismatic epithelial cells (arrow) with typical villus structure are observed (MHDS: 2(2–1)). (K) (×200), (L) (×400) Group 6: Small intestinal tissue sections show villi with typical enterocytes and lamina propria (Lp) structures (MHDS: 1 (1–2)). (K) (×200), (L) (×400) Group 7: Reduced epithelial shedding (arrow), villar fusion, and interstitial inflammation, accompanied by diffuse villi composed of typical enterocytes and lamina propria (Lp) structures (MHDS: 1(1–1)).
Figure 1
Figure 1
Representative light microscopic pictures of small intestinal sections stained with Goldners Masson Trichrome stain. Villus (V), Lieberkühn crypt (Lc), Lamia propria (Lp), epithelium (E). (A) (×200), (B) (×400) Group 1: In the intestinal tissue sections of the control group, a mucosa (arrow) structure consisting of single-layer prismatic epithelium with typical villus structures is observed (MHDS: 0 (0–0)). (C) (×200), (D) (×400) Group 2: Sloughing of single-layer prismatic cells with microvilli (arrowhead) and villar fusions (spiral arrow) are observed in the villi. In addition, diffuse inflammations (curved arrows) are observed in the lamina propria (MHDS: 3.5 (3–4)). (E) (×20), (F) (×40) Group 3: Epithelial shedding (arrow), villus loss (spiral arrow) and reduction in inflammation are observed. (MHDS: 2 (2–2)). (G) (×200), (H) (×400) Group 4: Sloughing of enterocytes (arrow) and decrease in interstitial inflammation (spiral arrow) are observed (MHDS: 2(1–2)). (I) (×200), (J) (×400) Group 5: Single-layer prismatic epithelial cells (arrow) with typical villus structure are observed (MHDS: 2(2–1)). (K) (×200), (L) (×400) Group 6: Small intestinal tissue sections show villi with typical enterocytes and lamina propria (Lp) structures (MHDS: 1 (1–2)). (K) (×200), (L) (×400) Group 7: Reduced epithelial shedding (arrow), villar fusion, and interstitial inflammation, accompanied by diffuse villi composed of typical enterocytes and lamina propria (Lp) structures (MHDS: 1(1–1)).
Figure 2
Figure 2
Representative light microscopic pictures of small intestinal tissue sections incubated with Scl11a primary antibody. (A) (×400) Group 1: Normal single-layer prismatic epithelial cells with microvilli showing intense Scl11a positivity (arrow). (B) (×400) Group 2: Single-layer prismatic epithelial cells (arrow) with microvilli show decreased Scl11a positivity (arrowhead). (C) (×40) Group 3: An increased number of cells showing Scl11a positivity is observed in epithelial cells in the villi (arrow). (D) (×400) Group 4: Epithelial cells in the villi show a large number of cells showing Scl11a positivity (arrow). (E) (×400) Group 5: Intense immunopositivity is observed in single-layer prismatic epithelial cells. (arrow) (F) (×400) Group 6: Enterocytes showing intense immunopositivity are observed to be increased in number (G) (×400) Group 7: Intense immunopositivity is observed in enterocytes in large numbers forming the epithelium of the villi (arrow).
Figure 2
Figure 2
Representative light microscopic pictures of small intestinal tissue sections incubated with Scl11a primary antibody. (A) (×400) Group 1: Normal single-layer prismatic epithelial cells with microvilli showing intense Scl11a positivity (arrow). (B) (×400) Group 2: Single-layer prismatic epithelial cells (arrow) with microvilli show decreased Scl11a positivity (arrowhead). (C) (×40) Group 3: An increased number of cells showing Scl11a positivity is observed in epithelial cells in the villi (arrow). (D) (×400) Group 4: Epithelial cells in the villi show a large number of cells showing Scl11a positivity (arrow). (E) (×400) Group 5: Intense immunopositivity is observed in single-layer prismatic epithelial cells. (arrow) (F) (×400) Group 6: Enterocytes showing intense immunopositivity are observed to be increased in number (G) (×400) Group 7: Intense immunopositivity is observed in enterocytes in large numbers forming the epithelium of the villi (arrow).
Figure 3
Figure 3
Representative light microscopic pictures of small intestinal tissue sections incubated with IRE1 primary antibody. (A) (×400) Group 1: Normal enterocytes and IRE1-negative enterocytes are observed in the small intestine sections of the control group (arrowhead). (B) (×400) Group 2: Enterocytes showing intense IRE1 positivity are observed to be common (arrow). (C) (×400) Group 3: Enterocytes showing IRE1 positivity were observed to be reduced in number (arrowhead). Immune-negative cells (arrowhead). (D) (×400) Group 4: Enterocytes showing IRE1 positivity in the villi are decreased (arrow). Immune-negative cells (arrowhead). (E) (×400) Group 5: Enterocytes in the villi are observed to be diffusely immune-negative (arrowhead). (F) (×400) Group 6: Enterocytes showing intense IRE1 positivity are decreased in number (arrowhead). (G) (×400) Group 7: Enterocytes showing intense IRE1 positivity were decreased in number (arrowhead).
Figure 3
Figure 3
Representative light microscopic pictures of small intestinal tissue sections incubated with IRE1 primary antibody. (A) (×400) Group 1: Normal enterocytes and IRE1-negative enterocytes are observed in the small intestine sections of the control group (arrowhead). (B) (×400) Group 2: Enterocytes showing intense IRE1 positivity are observed to be common (arrow). (C) (×400) Group 3: Enterocytes showing IRE1 positivity were observed to be reduced in number (arrowhead). Immune-negative cells (arrowhead). (D) (×400) Group 4: Enterocytes showing IRE1 positivity in the villi are decreased (arrow). Immune-negative cells (arrowhead). (E) (×400) Group 5: Enterocytes in the villi are observed to be diffusely immune-negative (arrowhead). (F) (×400) Group 6: Enterocytes showing intense IRE1 positivity are decreased in number (arrowhead). (G) (×400) Group 7: Enterocytes showing intense IRE1 positivity were decreased in number (arrowhead).
Figure 4
Figure 4
Representative light microscopic pictures of small intestinal tissue sections incubated with Wnt2 primary antibody. (A) (×400) Group 1: In the small intestine sections of the control group, Wnt2-negative enterocytes with normal structure are observed (arrowhead). (B) (×400) Group 2: Enterocytes showing intense Wnt2 positivity are observed to be common (arrow). (C) (×400) Group 3: Enterocytes showing Wnt2 positivity were observed to be reduced in number (arrow). Immune-negative cells (arrowhead). (D) (×400) Group 4: Enterocytes showing Wnt2 positivity in the villi are decreased (arrow). Immune-negative cells (arrowhead). (E) (×400) Anemia Group 5: Wnt2-negative enterocytes (arrow) in the villi are commonly observed (arrowhead). (F) (×400) Group 6: Enterocytes showing intense immunopositivity are reduced in number (arrowhead). (G) (×400) Group 7: Enterocytes showing intense Wnt2 positivity are reduced in number.
Figure 4
Figure 4
Representative light microscopic pictures of small intestinal tissue sections incubated with Wnt2 primary antibody. (A) (×400) Group 1: In the small intestine sections of the control group, Wnt2-negative enterocytes with normal structure are observed (arrowhead). (B) (×400) Group 2: Enterocytes showing intense Wnt2 positivity are observed to be common (arrow). (C) (×400) Group 3: Enterocytes showing Wnt2 positivity were observed to be reduced in number (arrow). Immune-negative cells (arrowhead). (D) (×400) Group 4: Enterocytes showing Wnt2 positivity in the villi are decreased (arrow). Immune-negative cells (arrowhead). (E) (×400) Anemia Group 5: Wnt2-negative enterocytes (arrow) in the villi are commonly observed (arrowhead). (F) (×400) Group 6: Enterocytes showing intense immunopositivity are reduced in number (arrowhead). (G) (×400) Group 7: Enterocytes showing intense Wnt2 positivity are reduced in number.
Figure 5
Figure 5
Representative light microscopic images of small intestinal tissue sections incubated with CD71 primary antibody. (A) (×400) Group 1: CD71-negative enterocytes are observed in normal villi of the control group (arrowhead). (B) (×400) Group 2: Enterocytes showing intense Wnt2 positivity are observed in the villi (arrow). (C) (×400) Group 3: Enterocytes showing intense immunopositivity are reduced in number (arrow). Immune-negative cells (arrowhead). (D) (×400) Group 4: The number of enterocytes showing immunopositivity in the villi is decreased. Immune-negative cells (arrowhead). (E) (×400) Group 5: CD71-negative enterocytes are commonly observed in thin nares tissue sections (arrowhead). (F) (×400) Group 6: Enterocytes showing intense CD71 positivity were reduced in number (arrowhead). (G) (×400) Group 7: Enterocytes showing CD71 positivity are reduced in number (arrowhead).
Figure 5
Figure 5
Representative light microscopic images of small intestinal tissue sections incubated with CD71 primary antibody. (A) (×400) Group 1: CD71-negative enterocytes are observed in normal villi of the control group (arrowhead). (B) (×400) Group 2: Enterocytes showing intense Wnt2 positivity are observed in the villi (arrow). (C) (×400) Group 3: Enterocytes showing intense immunopositivity are reduced in number (arrow). Immune-negative cells (arrowhead). (D) (×400) Group 4: The number of enterocytes showing immunopositivity in the villi is decreased. Immune-negative cells (arrowhead). (E) (×400) Group 5: CD71-negative enterocytes are commonly observed in thin nares tissue sections (arrowhead). (F) (×400) Group 6: Enterocytes showing intense CD71 positivity were reduced in number (arrowhead). (G) (×400) Group 7: Enterocytes showing CD71 positivity are reduced in number (arrowhead).

Similar articles

References

    1. Özbey A., Öncül N., Erdoğan K., Yıldırım Z., Yıldırım M. Some Physical, Chemical and Microbiological Properties of Çalma Pekmez Produced in Tokat Region, Turkey. [(accessed on 23 December 2023)];Akad. Gıda. 2013 11:46–52. Available online: https://dergipark.org.tr/tr/pub/akademik-gida/issue/55794/763795.
    1. Akbulut M., Özcan M. Some Physical, Chemical, and Rheological Properties of Sweet Sorghum (Sorghum bicolor (L) Moench) Pekmez (Molasses) Int. J. Food Prop. 2008;11:79–91. doi: 10.1080/10942910701233389. - DOI
    1. Salık M.A., Arslaner A., Çakmakçı S. Determination of Some Physical, Chemical and Antioxidant Properties of Erzincan Traditional Mulberry Pekmez (Molasses) Turk. J. Agric. Food Sci. Technol. 2021;9:181–190. doi: 10.24925/turjaf.v9i1.181-190.3802. - DOI
    1. Akbulut M., Özcan M.M. Comparison of mineral contents of mulberry (Morus spp.) fruits and their pekmez (boiled mulberry juice) samples. Int. J. Food Sci. Nutr. 2009;60:231–239. doi: 10.1080/09637480701695609. - DOI - PubMed
    1. Cifci A., Özkan M. Iron physiopathology and approach to iron deficiency anemia: New treatment strategies. J. Health Sci. Med. 2018;1:40–44. doi: 10.32322/jhsm.430073. - DOI

LinkOut - more resources